

Unlike error monitoring solutions that primarily provide context through capturing individual events, Embrace surfaces data and insights across entire user experiences. Embrace collects the complete technical and behavioral details for 100% of sessions, including:
- Full user journeys
- Views/screens/activities
- Timing and outcome of network calls and key user moments
- Device states like connectivity, CPU pegging, low memory warnings, and low power mode
- Taps and button presses
That’s powerful context to solve many issues without having to reproduce them manually. However, mobile teams can supplement this visibility by adding their own logs and breadcrumbs. These log types serve different use cases, so in this post, we’ll cover what they are and when you should use logs versus breadcrumbs when augmenting your session context.
What are logs?
Logs are individual events that are captured and sent in real-time. Embrace sends them in real-time because, in other tools that wait to send them at the end of the session or in chunks, they are often never sent. Thus in the worst-case conditions wherein a user never returns, or the data isn’t saved to disk, the logs are lost, and the team runs blind.
Since logs are sent immediately with a network call, they incur CPU costs and network bandwidth each time they fire. Excessive logging can degrade app performance, so be sure to only use logs for events that need to trigger an alert when they fail. In other words, if you are not investigating the failures you are logging, they could probably be replaced with breadcrumbs.
Logs are displayed within the user session they occurred in, but they are also available in many other areas of the Embrace dashboard, including:
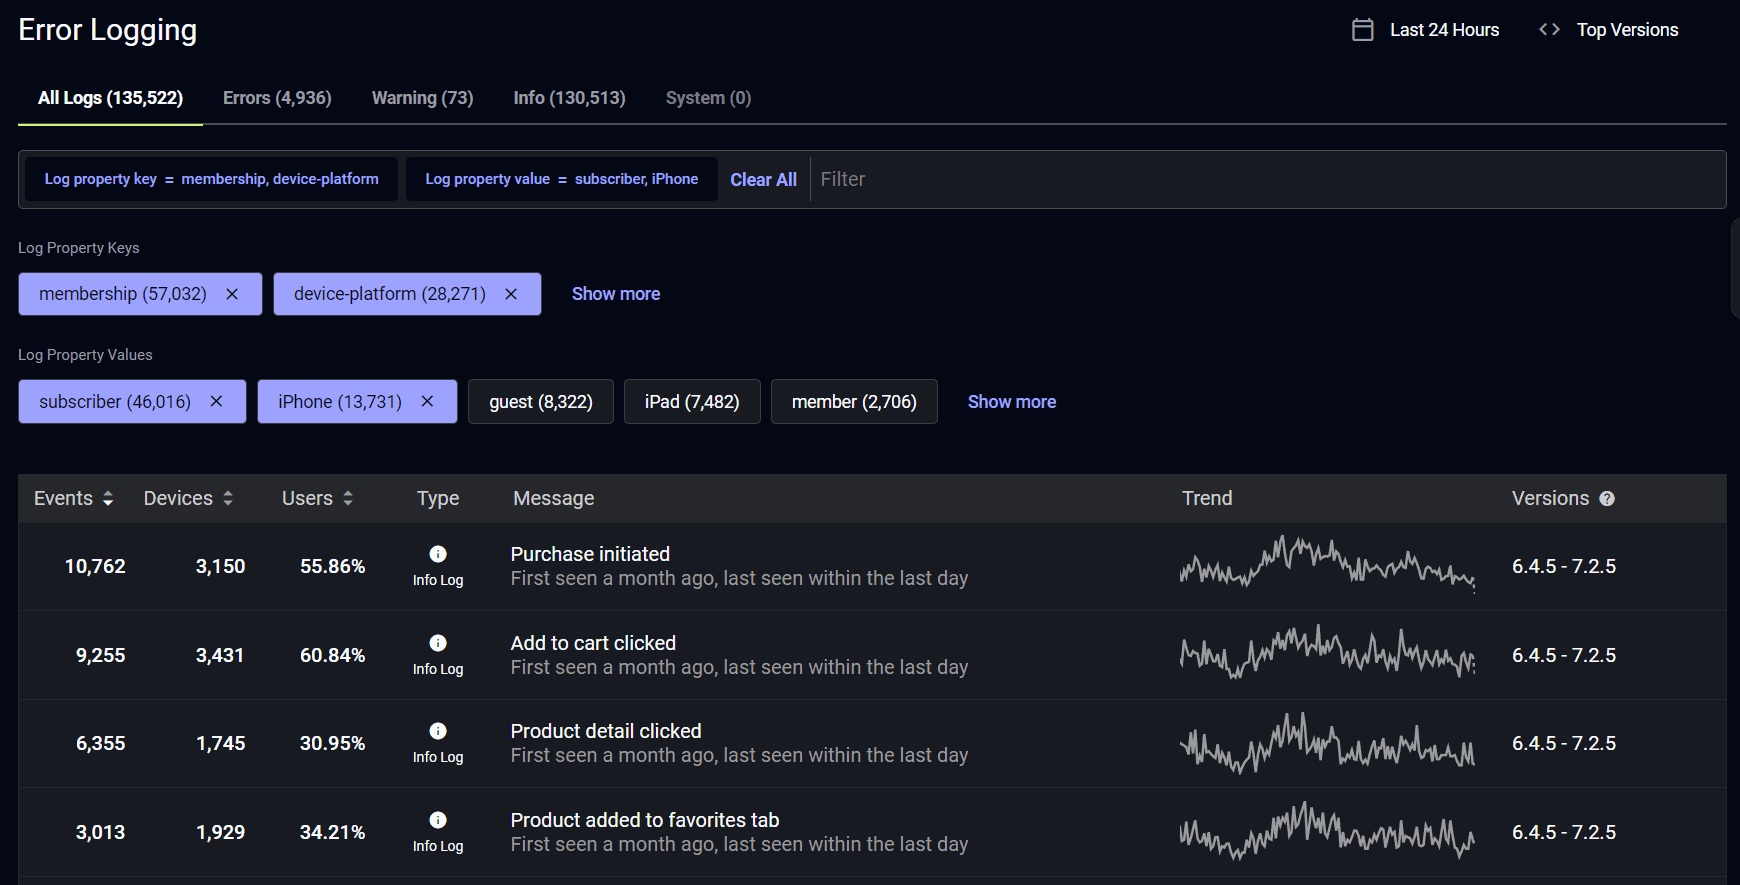
They are aggregated, searchable, and can be heavily customized by adding properties as key-value pairs. The following image highlights how you can filter for specific segments when investigating issues. This example focuses on issues affecting our subscribers who use iPhones.
Embrace supports multiple log types, including:
- Info log – are used to send helpful information that you want to be made available that is logged under normal conditions. Such as, successful initialization, how long it takes services to start and stop, or successful completion of significant transactions. Viewing an info log should give a quick overview of major state changes, providing top-level context for understanding any warnings or errors.
- Warning logs – are used for anything that can cause application oddities that are automatically recovering, such as retrying an operation, switching from a primary to the backup server, missing secondary data, etc. Meaning your users can usually work around it if it fails. Warning logs should be used sparingly so they do not become meaningless, use warning logs to log, expected transient environmental conditions such as temporary loss of network or database connectivity.
- Error logs – are used for fatal problems to the operation that should be investigated, usually reserved for incorrect connection strings, missing services, etc. For example, users can’t open a required file, there is missing data, an exception from a vital piece of code that was handled, an exception when trying to load a site or download an essential asset that the app can not continue without.
Your mobile teams can most likely take your app’s info logs and most warning logs and convert them into breadcrumbs with minimal effort or changes.
When should you use logs?
Logs should be used for issue discovery and tracking events associated with engagement, retention, and revenue. Mobile teams can leverage logging to track and improve both team and company KPIs. The following are several excellent examples of events to log:
- User experience-impacting events like logging in, requesting a ride, or creating a post
- Revenue-impacting events like adding an item to the cart, making a purchase, or upgrading a subscription plan
- Unique events like applying a one-time promo code or downloading special content
- User engagement events such as liking a profile, adding an item to favorites, or streaming a video
- Technical events like loading a map, launching a video player, or displaying a product list
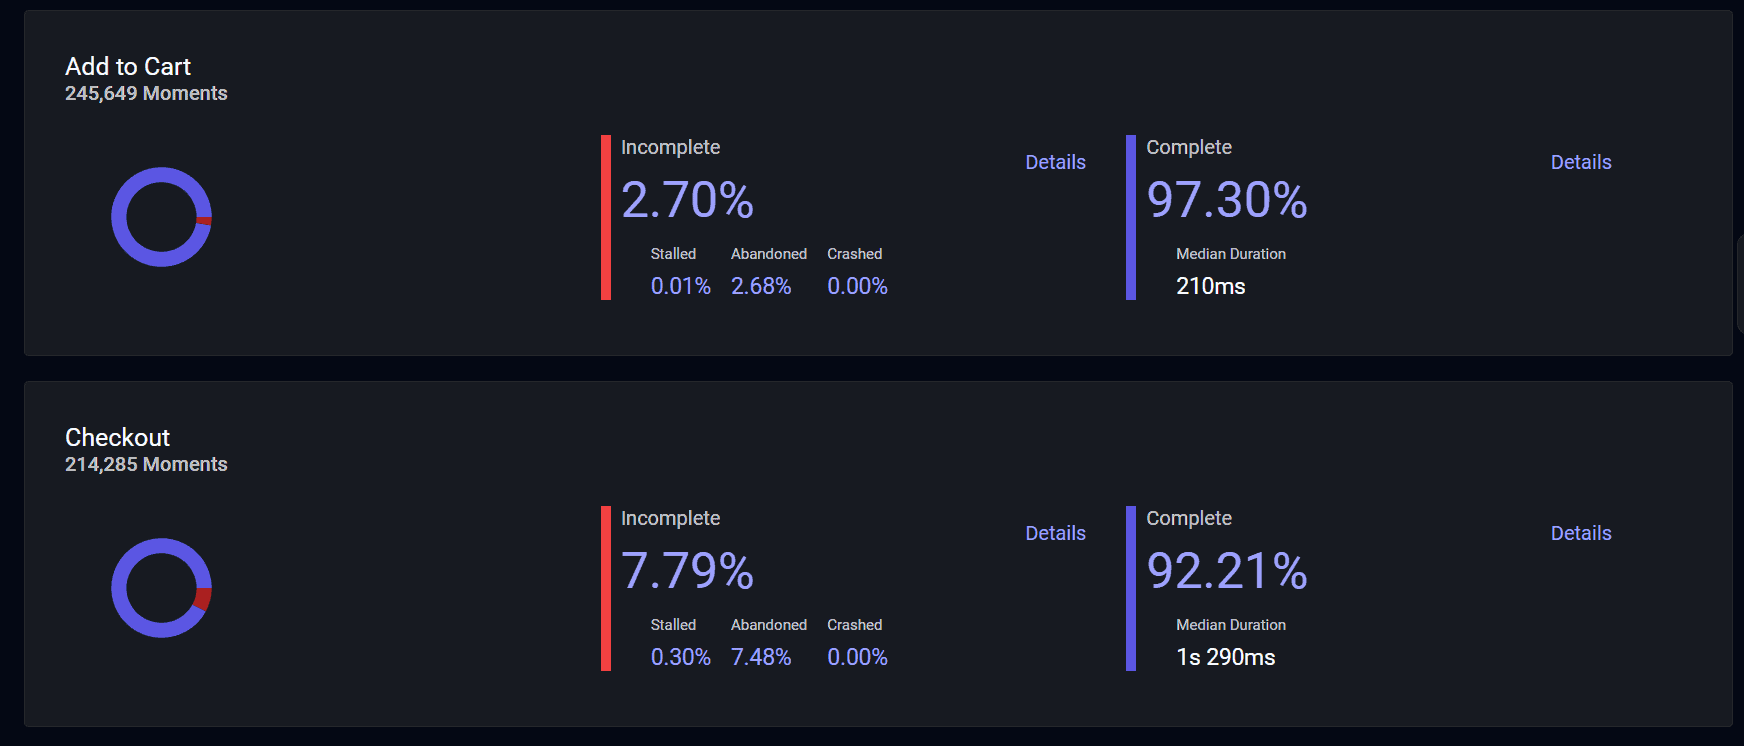
You can add logs within your key user moments for better visibility into why users are abandoning them. For example, let’s say you have an e-commerce app. You could wrap your purchase flow in a Moment, which is Embrace’s way of tracking the timing and outcome of high-value user actions.
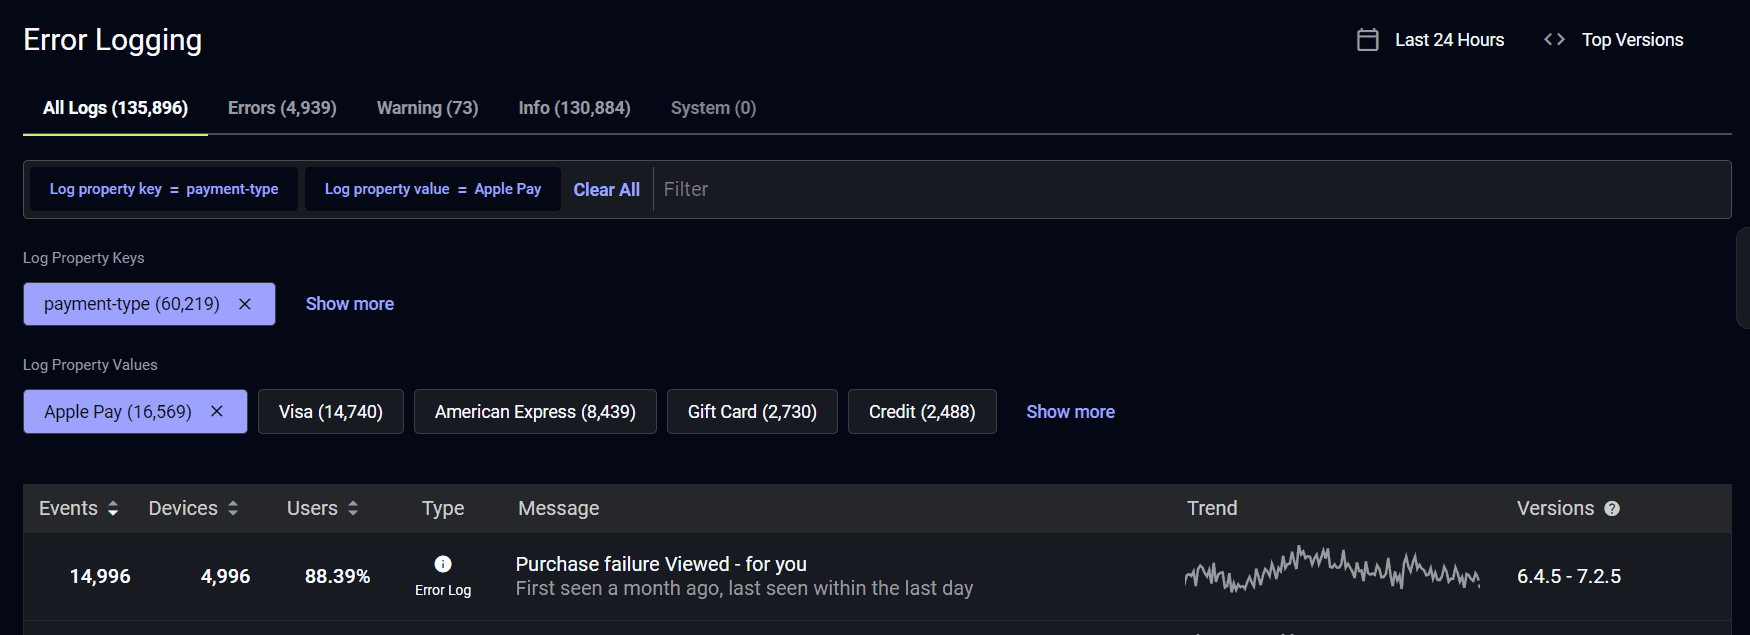
If you see a spike in purchase abandons, you can dive into the associated logs. By adding log properties to your purchase failure error logs, you can investigate if the root cause stems from specific payment providers, like Apple Pay, Visa, or PayPal.
The above example should highlight the benefits of Embrace’s comprehensive approach to mobile user experience monitoring. You can uncover slowdowns, user abandons, and technical failures in multiple ways while always being able to drill down to the underlying root cause within the affected sessions.
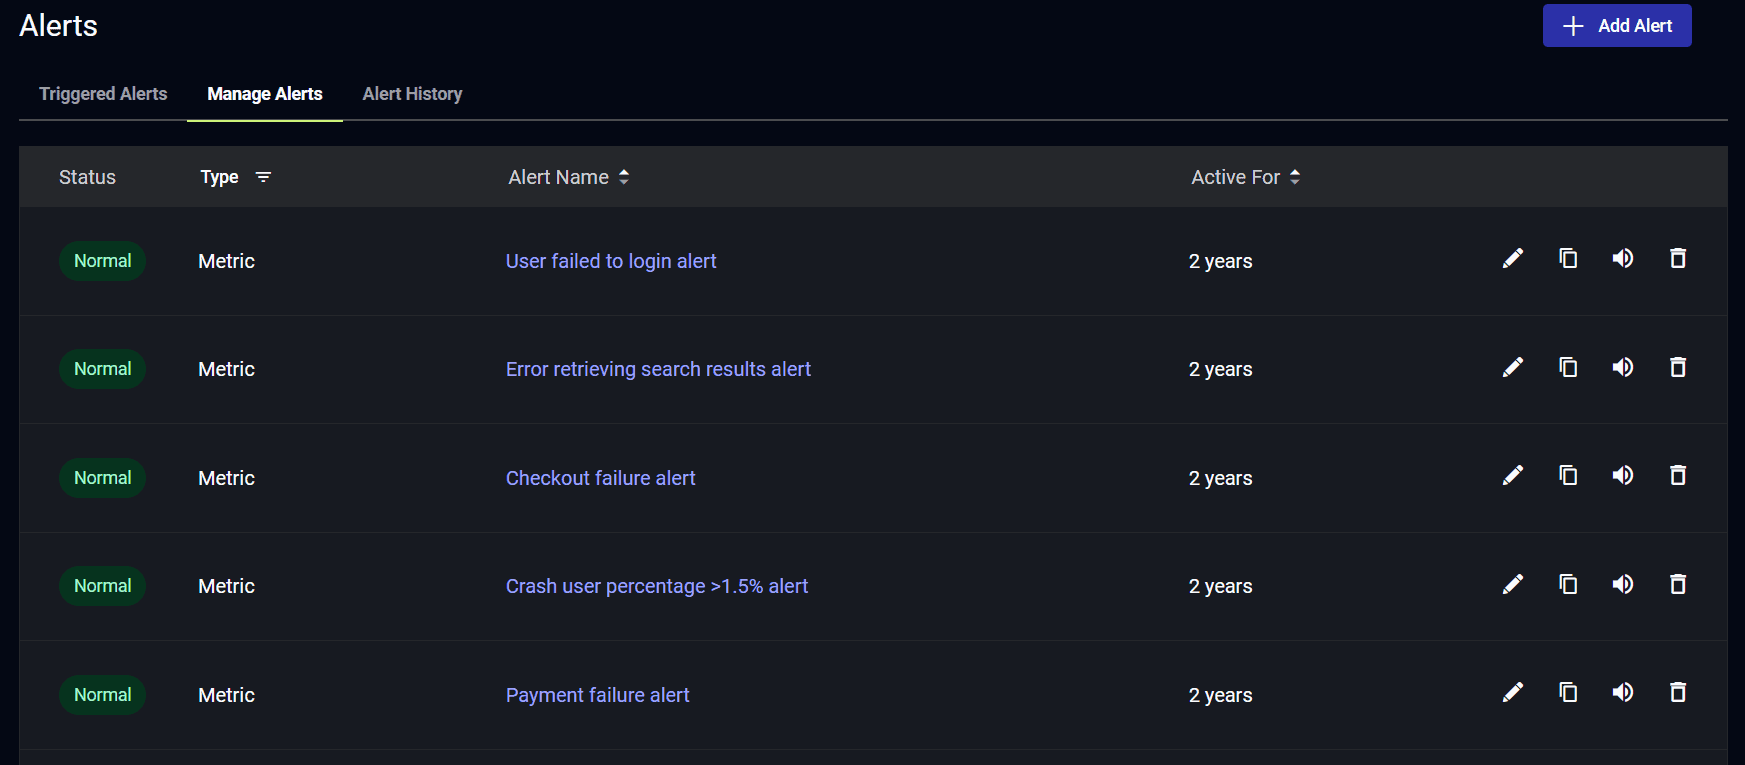
With Embrace, you can alert on many different metric types, including error, session outcome, general health, and app performance. Mobile teams can be alerted to spikes in logs based on the time windows and conditions that work for their needs.
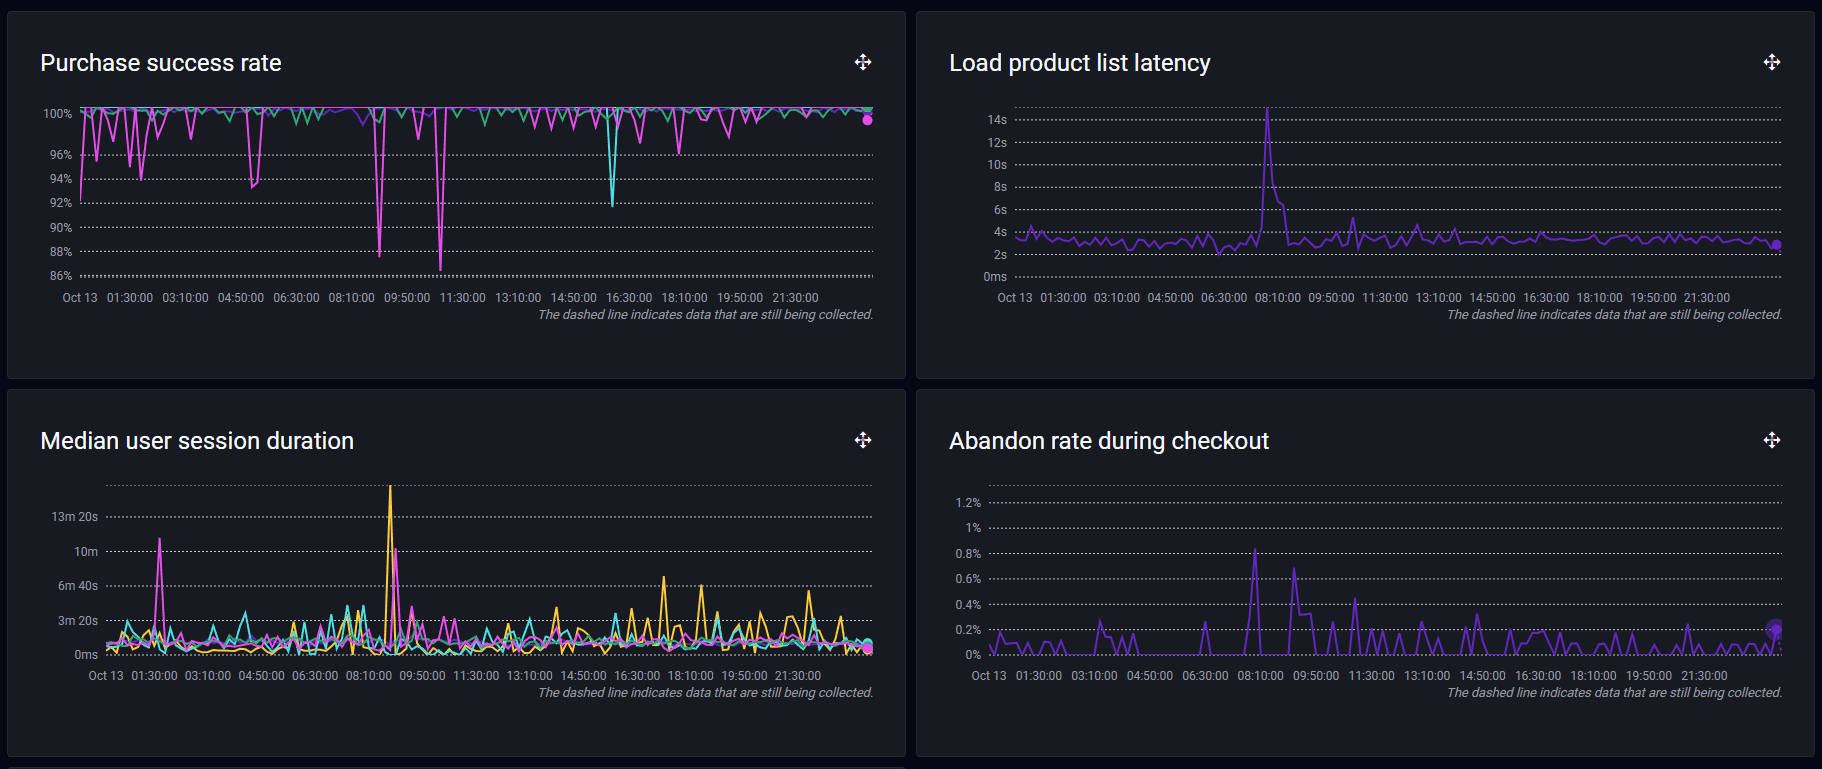
In addition, teams can create real-time dashboards to track any metric they care about, including logs. The following image highlights a monetization dashboard, showing both successful and failed purchases over time.
Mobile teams should be logging anything that won’t be obvious from other events in the session. However, you should think carefully about the logging that you add. Your mobile teams will be looking at these logs days after a problem session occurred and without access to the user who created the session. Your logs must be detailed enough to help you generate a reproducible use case but light enough that they don’t distract you or cause you to read redundant information.
For example, Embrace already collects all network calls by default. Before you add logging around these events, inspect your sessions in the Embrace dashboard to ensure you’re adding meaningful context. Since Embrace collects 98% of events with a basic integration, you might not need to add much to start optimizing many areas within your mobile apps. Logging too much can impact app performance and bloat your issue resolution times as engineers are forced to wade through excessive logs that only add noise.
What are breadcrumbs?
Breadcrumbs are a lightweight way to add logging to your session. They are not captured and sent in real-time but are instead metadata that is collected as part of the overall session. They are sent to the server within the session payload at the end of the individual session. Thus, no matter how many breadcrumbs you add for visibility, they will only require one network call, making them far more efficient in terms of system resources and network bandwidth than traditional logs. To summarize, breadcrumbs add no CPU, no memory overhead, trigger no individual network calls, and have zero impact on app performance.
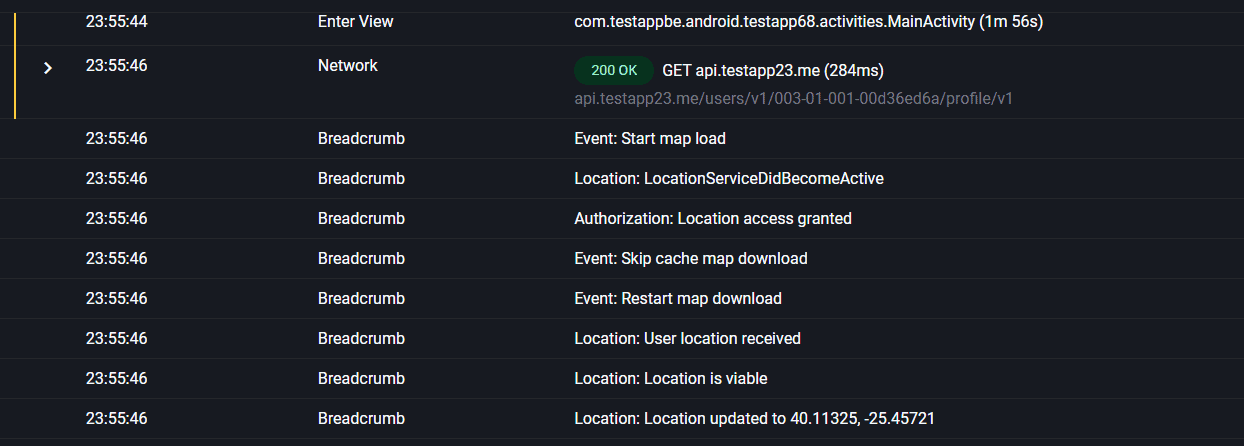
In the below example, we’ve added helpful breadcrumbs to outline the progression of loading a map within our app.
When should you use breadcrumbs?
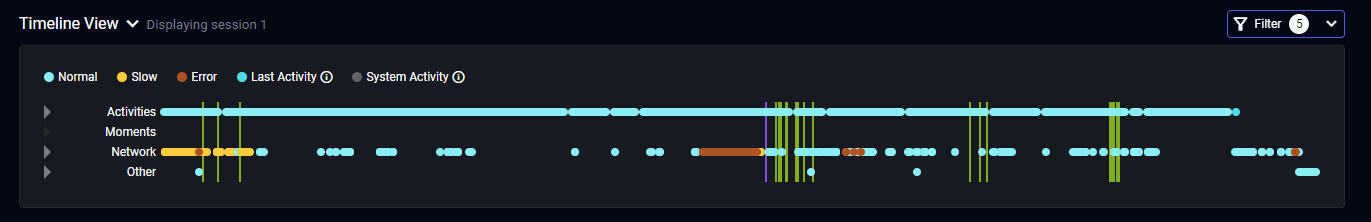
Breadcrumbs are great to provide additional session context when debugging. When investigating a user session, you can easily inspect all breadcrumbs in the session timeline view and click to be taken directly to them in the activity log of all session events.
The following are a few significant use cases for breadcrumbs:
- Tracking local user states like whether they have tapped on a sidebar, navbar, or carousel
- Tracking general app state, such as by emitting state machine changes
- Tracking the progress of complex actions like loading a map, scrolling through multiple images/posts, or filling out a form
However, because breadcrumbs are tied to the sessions themselves, they are not aggregated like traditional logs. This means you cannot add custom properties to them, alert on them, or otherwise monitor them outside of the session they occur in. You should not use breadcrumbs for tracking failures, areas to optimize, or key user actions like making a purchase.
Breadcrumbs are ideal for understanding the complete user journey and technical details within a single session.
Key questions to ask when choosing between a log and a breadcrumb
Sometimes, it might not be clear which form of logging to add. To guide you toward the right decision, consider the following questions:
- Are you counting the number of successes and failures?
- Are you tracking the improvement of this metric over time?
- Is this a business or team KPI?
Answering yes to the above questions means you want aggregated, searchable metrics of this specific event, which points you toward using logs.
- Is this just supporting context when debugging another issue?
- Is the only interested stakeholder an engineer investigating an issue?
- Is this event limited in scope to specific user actions or technical details within an individual session?
Answering yes to the above questions means you only need access to this data when investigating a particular user experience, which points you towards using breadcrumbs.
Other ways to add visibility with Embrace
While we have discussed the benefits of using logs and breadcrumbs, Embrace provides additional ways to add information that can be used when monitoring performance or remediating issues. The following are a few of these examples:
- Session properties are used to track information about the device or session. For example, you could segment by which sessions are part of an experiment, promotion, or feature. You could also segment by device groupings like investigating issues affecting only the POS devices within a given store location.
- Moments are used to track the timing, failures, and user abandons of your key moments like startup, add to cart, and purchase.
- User personas are used to drill down to specific user segments like low versus high LTV users.
Final thoughts
Embrace’s logging and breadcrumbs features provide a powerful way to supplement your mobile visibility. Breadcrumbs can be leveraged for additional debugging context within specific user sessions, and logs can be used to track key failure points that impact revenue, retention, and engagement.
Breadcrumbs are lightweight, performant, and collected as part of the associated session’s payload. Logs are collected as single events that are sent in real-time. They provide visibility across the Embrace dashboard, but overuse can impact app performance.
Remember to tailor your integration to your specific goals and KPIs and avoid adding noise at the expense of meaningful context. That way, your mobile team can deliver better mobile user experiences that drive incredible business outcomes.
If you’d like to see how complete mobile visibility can revolutionize how you deliver incredible mobile experiences, get started with a free trial today.
Get started today with 1 million free user sessions.
Get started free