
How do you debug a crash when the crash report doesn’t provide any actionable information?
Well, you can go through your codebase line by line. That’s always an option.
Or you can use Embrace, a platform built specifically for mobile developers to track down bugs and improve their app’s performance.
Recently, a customer contacted us about a crash that they couldn’t debug. By using Embrace’s User Timeline, we were able to find the actual user sessions that terminated in those crashes. This enabled us to create a testing procedure to recreate the crash. We recreated the crash and then made sense of the unusual crash reports it generated. Once we pinpointed what the cause of the crash was, we recommended a way for the app’s developers to fix the bug.
For those who are fans of proper segmentation, this article can be broken down into three parts:
- How Embrace’s User Timeline was able to gather enough information to build a testing procedure
- How we made sense of the weird crash reports we generated from our testing
- How we used iOS syslogs to find the bug
Let’s get to it!
How Embrace’s User Timeline was able to gather enough information to build a testing procedure
In this section, we’ll go over the original Crashlytics crash report the customer gave us and how by using the Embrace User Timeline we were able to build a testing procedure to reproduce the crash.
Crash report from Crashlytics
The customer reported they were seeing a high incident rate for a new type of crash in their Crashlytics reporting instance. The crash was an EXC_BAD_ACCESS but the reports were corrupted.
#18. Crashed: emb.queues.latemessages
0  libdispatch.dylib              0x1ab3d047c _dispatch_lane_serial_drain + 612
1  (Missing)                      0x0 (Missing)
2  (Missing)                      0x0 (Missing)
3  (Missing)                      0x0 (Missing)
4  (Missing)                      0x0 (Missing)
There are 5 symbols, but the module and address are missing from frames 1 – 4. Also, the module referenced in frame 0 is an iOS one. This means that no app code showed up in the stack trace. This isn’t much information for the customer to go on.
Crash report in Embrace dashboard

Our version matches the Crashlytics crash report on these facts:
- The exception code is
EXC_BAD_ACCESS - The top frame is the same
serial_drainsymbol - The frame count is 5 frames
To get a better look at what possibly caused the crash, let’s look at a user session that ended with this crash type.
Embrace User Timeline
The User Timeline is an exact recreation of a user session. Every page, every click, every network call, everything. At Embrace, we don’t sample, so customers get access to every user session.
The following image is from the Embrace User Timeline. This feature is unique to Embrace.
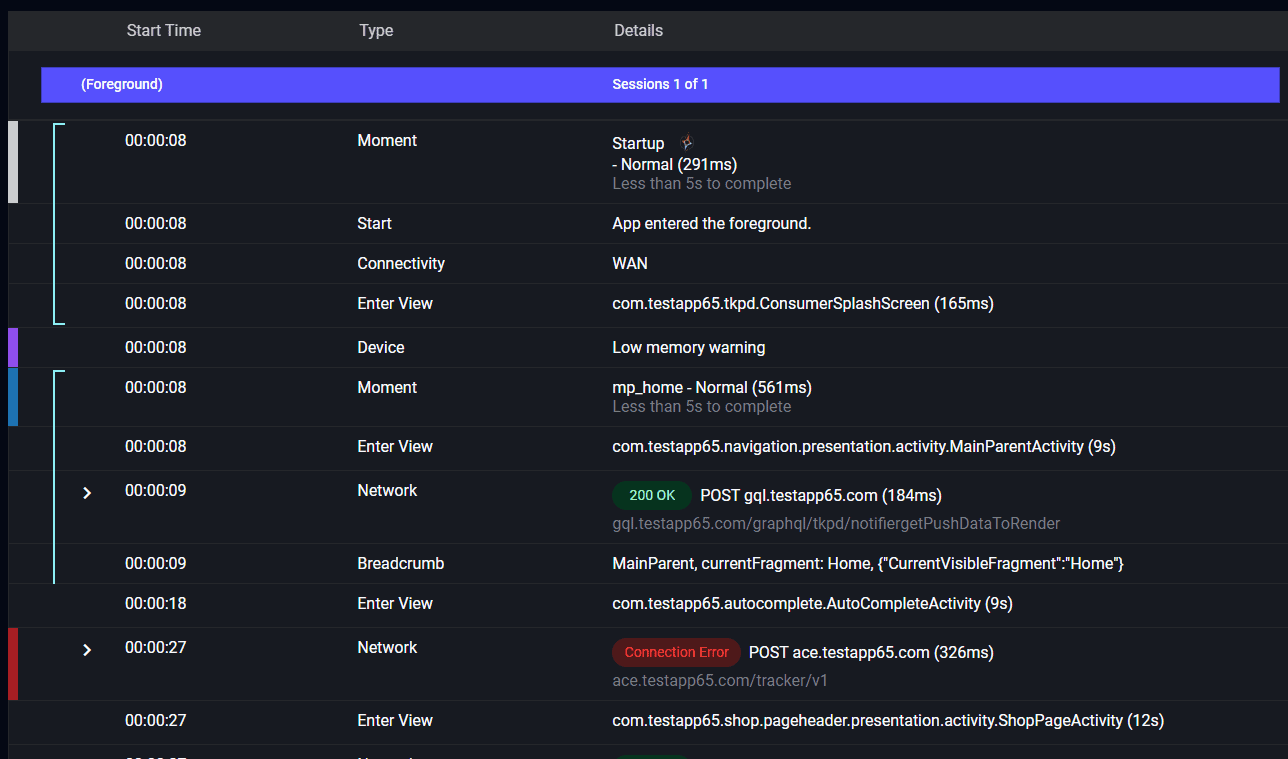
Note: we are blurring out the specific details about the customer. To give you enough information to follow along, the customer’s app involves users recording and uploading videos.
This is one sample, but there are many like it that all have the following features:
- The user is recording a video
- The user begins the upload process, and stays there for a few seconds
- The session becomes inactive (this indicates the user backgrounded the app)
- There are connection errors or other indicators of slow network activity
- The session ends with the
EXC_BAD_ACCESScrash
Look at all the information that our dashboard provided us! It looks like this is a background crash and not a foreground crash. Crashlytics cannot provide the context we relied on to make this determination, such as what actions the user was taking and how long they were doing them for. That information from the user session was the key to understanding this crash.
Also, we can assume users are not seeing these crashes (since they happen when the app is in the background), but users will see the effect of them the next time they launch the app.
How Embrace recreated the crash
Armed with this newfound information, we designed a testing procedure to recreate the crash:
- Use the weakest phone we have, an iPhone SE
- Use network link conditioning to simulate an edge connection
- Record a video
- Press the upload button
- As soon as the upload progress indicator appears, background the application
- Monitor the iOS system log to observe background activity
How we made sense of the weird crash reports we generated from our testing
Nearly all test runs following the above procedure resulted in a background app termination. Check out an Apple report pulled from our test device:

This is a wall-clock time kill report. We know this because assertiond terminated the process with the code 0xbadf00d. Assertiond is the iOS system daemon responsible for monitoring application performance and access rights at runtime. Two things it monitors are the wall-clock time and the CPU time a process has access to.
Wall-clock time is the amount of time (e.g. as measured on a wall clock) that has elapsed since the process started. The system doesn’t care if the process is actively doing anything or waiting for other processes or network requests to complete. All the system cares about is the amount of time that has elapsed while a process is running.
CPU time is the total execution time or runtime for which the CPU was dedicated to a process. For example, in a dual core processor, a process running in both cores will only be able to run for half the wall-clock time because the process is running on two cores, which effectively doubles the amount of CPU time.
The code 0x8badf00d is specifically a wall-clock time assertion, meaning assertiond killed the background process for exceeding the limit for its wall-clock time (30 seconds).
An important point is that these reports do not flow well through Crashlytics as it may interpret the exception or any other part of the SIGKILL event incorrectly. This is because when an app is killed by a SIGKILL, the OS shuts the app down and any processes associated with it immediately.
This is not a clean shutdown.
This is the OS saying, “Shut it down now! I don’t care how! Just do it!”
As such, the application’s threads are terminated as quickly as possible. However, they are not all terminated at the same time, which leads to threads losing access to critical resources as the process is dying and throwing exceptions that further confuse the process’s shutdown procedures.
What’s happening is that Crashlytics is picking up these odd exceptions and labeling them as the reason the app died. But in reality, they are just side effects stemming from the real reason, which is a SIGKILL.
Observe a second form of this report, also pulled from our test device:

This is a CPU time kill report, generated by the same testing conditions as the previous one. It means the application was using too much CPU while in the background. The OS does not allow this as it wants to reserve CPU for foreground processes.
Notice in this report that the stack trace shown very closely matches the corrupt stack traces from the initial reports of this issue. This is further support for the app being shut down by the OS for exceeding usage and time limits for a backgrounded app.
How to use iOS Syslog to fix the bug
At Embrace, we don’t have access to the app’s code, so there is only so much we can do before the developers have to take over. These are the steps we recommended the developers take to fix the bug:
- Discover which background task in your app is overrunning CPU/wall time
- Follow the repro procedure while debugging the app with Xcode. This should cause the program to break instead of crash as the task overruns the limits.
- Look in the code for places that call the
beginBackgroundTaskAPI on UIApplication. - Use the iOS syslog to help troubleshoot
Here is an example of the syslog from a reproduction we did on our test device. This is accessed in the Console app on the Macbook tethered to the test device.

We’ve highlighted relevant lines. Note that we’ve filtered by the app name keyword to reduce noise. What we see are calls from assertiond. The first call is a warning that the application is approaching the limit on one of the background tasks. The second call lets us know which task it is. A developer could take the address of that task and search the console log for it to see when it was created. The third call is the final termination call that killed the application.
Summing up what we’ve learned
Debugging crashes that occur when an app is in the background are very difficult because the crash reports likely will have corrupted information. A platform like Embrace helps immensely by allowing you to recreate the user session that led up to the crash. This allows you to isolate the steps that led to the crash, which you can then use to generate testing procedures to reproduce it. With a reproduced crash, you can use native tools like Console’s syslogs to track down the source of the bug.
In this example, the app’s functionality was recording and uploading videos. These are resource-intensive tasks. Developers need to be aware of how their app will handle these types of tasks when their app is put in the background.
The three main ways are:
- The app can hurry up and finish the task in the background. Be careful of time and resource limits, as the iOS watchdog will kill your app for going over these limits.
- The app can defer the process until the app is launched again.
- The app can request that the iOS handle the task. In our video uploading example, you could have NSURLSession handle the video upload while the app is in the background.
We hope this article showed you how powerful the Embrace platform is for enabling crash reproduction testing procedures. Without Embrace’s User Timeline, we wouldn’t have enough information to help our customer figure out their crash.
This article only touched on one feature of the Embrace platform, but we are a one-stop shop for your application performance monitoring and error debugging needs. We know that every user session is different, and tracking down bugs is about finding the exact session they happened on. That’s why we store every single user session and allow you to access them.
After all, sometimes the only way to make sense of a crash is to see exactly what caused it.
If you’d like to learn more about Embrace, you can check out our website or request a demo.
Get started today with 1 million free user sessions.
Get started free