

Mobile teams struggle to solve out-of-memory crashes (OOMs) because their monitoring solution cannot provide enough context to identify the root cause. Since OOMs are system kills for exceeding resource limits, they are abrupt app terminations that rarely produce a usable stack trace.
With Embrace, mobile teams have full session context for every user experience, which provides a wealth of diagnostic information to identify, prioritize, and solve the root cause of OOMs. This post will cover why it’s crucial to monitor OOMs and how Embrace provides best-in-class data and insights to solve OOMs before they impact your users and business.
Quick note: Don’t forget to check out our on-demand webinar, How to Skyrocket Your Mobile App Performance, to deep dive into how your team can optimize your mobile app!
Why is it important to solve OOMs?
An OOM looks and feels like a crash to a user, so these issues should be treated with the same level of importance. They will both result in negative reviews, reduced engagement, and ultimately, churn.
Two main issues can cause OOMs:
- Memory leaks – occur when memory is allocated, and all references to that allocation are lost, so it becomes impossible to free the memory. This can happen with lower-level API calls such as CoreVideo or CoreAudio.
- Memory abandonment – occurs when memory is allocated, and then a reference is maintained but never used again, so it becomes unnecessary for the memory to be allocated. This can happen with any type of object or API.
In iOS, the most common type of issue that causes OOMs is memory abandonment since, usually, ARC handles freeing memory. The most common place for this to occur is on webviews since a large amount of assets are used for webviews.
Mobile teams frequently don’t know the extent of their OOM problem because crash reporting and error monitoring solutions can underreport or even misclassify OOMs. There isn’t much data for these event-based platforms to report without a clean stack trace.
It’s not uncommon for mature mobile apps to be 99.95% crash-free yet only 97% OOM-free. That’s an order of magnitude difference! In this example, the mobile team has 60 times more crashes than they thought. So instead of focusing their engineering effort on solving the few known crashes, they would have a more significant impact by addressing the more prominent memory problems.
We’ll now cover how Embrace provides mobile-first visibility into addressing OOMs, including which screens they happen on, correlations to easily identify larger patterns, and the complete user session details so you can immediately spot the root cause.
How to identify, prioritize, and solve OOMs with Embrace
The first step to solving an issue is knowing there is a problem. With Embrace, mobile teams don’t have to wait for user complaints to take action. Teams can create alerts to be notified of regressions in performance, stability, and health metrics, including OOMs. In addition, they can track OOMs over time with real-time dashboards.
While event-based monitoring solutions rely on sending crash reports and error logs, Embrace can highlight powerful patterns across entire user experiences, which lets you hone in on the root cause of performance and stability problems that span beyond a single network call or line of code. OOMs are a great example of this because they can build up over several user actions and screens. Tracking the user’s journey while understanding all the technical details is crucial to see exactly where your app may be exceeding resource limits.
Next, we will dive into how you can identify, prioritize, and solve OOMs with Embrace.
View aggregate metrics with Embrace’s OOM summary page
Embrace provides teams with access to an OOM summary page which includes aggregate data about OOMs in your mobile application. This feature is beneficial because mobile teams can:
- Spot differences in OOMs across releases
- See the impact of OOMs across users and sessions
- Track OOM patterns over time
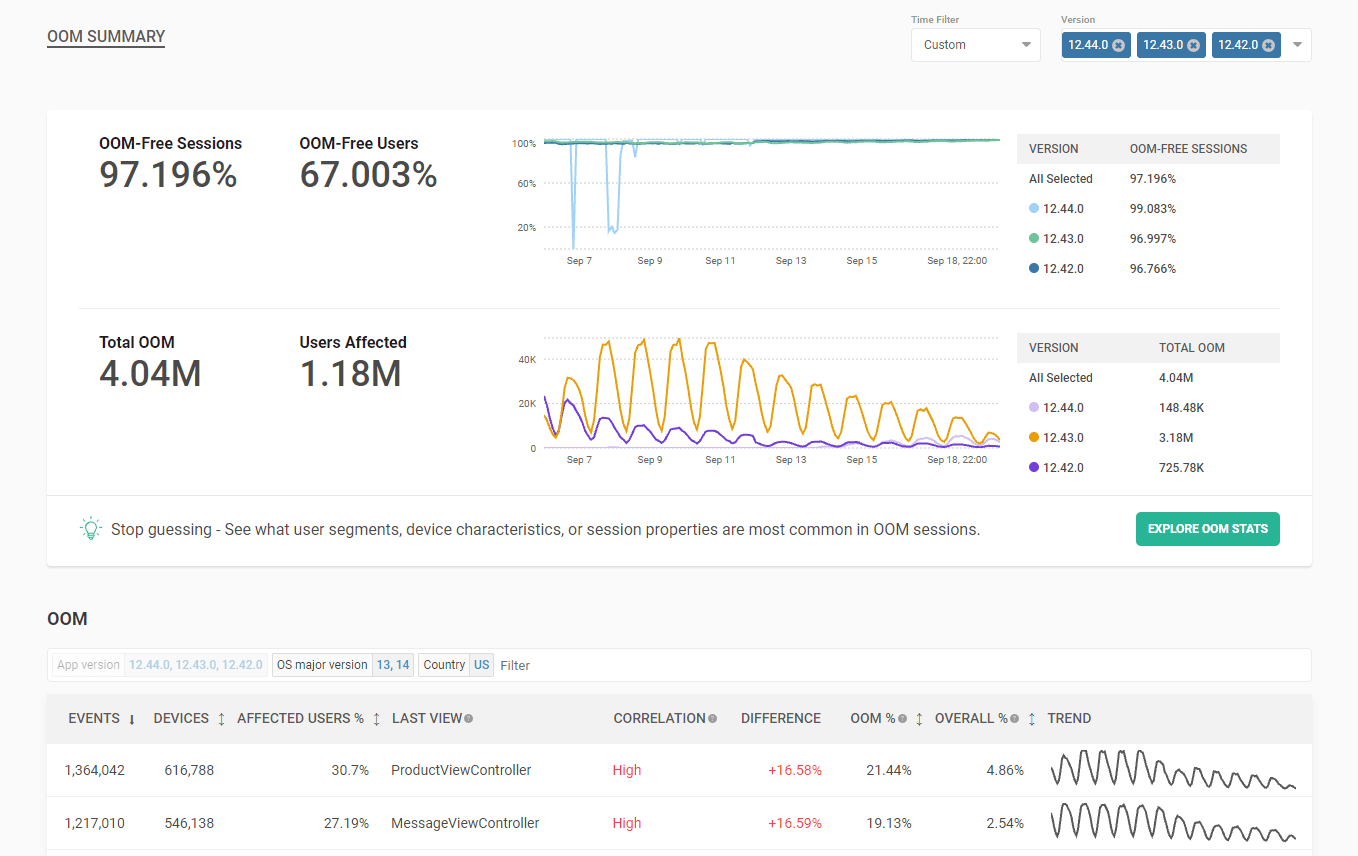
Embrace provides mobile teams with a table with several aggregate OOM metrics, including:
- Total OOMs for all versions selected in the given time period.
- Users affected by OOMs for all versions selected in the given time period.
- Visualization of OOM counts by version over time.
- Breakdown of OOM counts by version.
So far, these metrics are broken out by version, but what if mobile teams want to understand OOM patterns across different segments?
Discover insights and patterns with Embrace’s OOM stats page
The OOMs stats page provides insights across different attributes, including:
- Device – device the OOM occurred on.
- OS version – OS the OOM occurred on.
- Last captured view – view the OOM occurred on.
- Time of day (UTC) – time in UTC when the OOM occurred.
- Session properties – where OOMs occurred concerning pre-defined key-value pairs.
- Country – country the OOM occurred in.
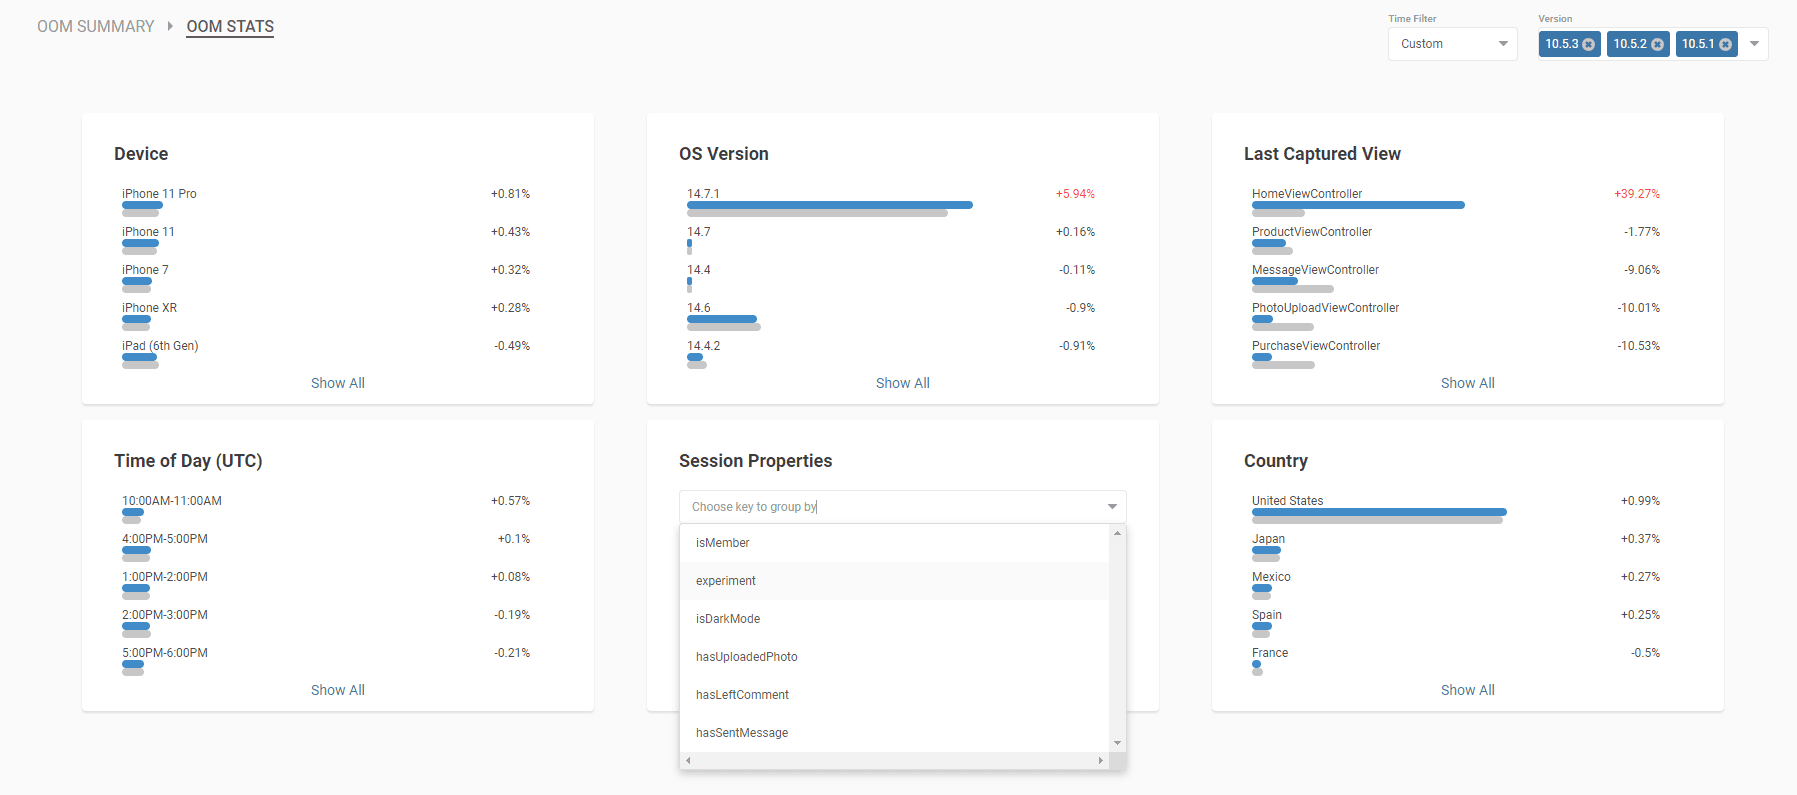
The blue line represents the proportion of total OOMs that occurred with the given attribute. The gray line represents the proportion of total sessions with the given attribute. Significant differences between the two lines indicate OOMs being over-or under-indexed on that attribute, pointing you towards a root cause.
As an example, let’s say:
- 70% of OOMs occur on OS 14.7.1
- 5% of total sessions occur on OS 14.7.1
Such a large discrepancy suggests that some interaction between your app and that specific OS might be leading to OOMs. Thus, the OOM stats page provides high-level context about where OOMs may disproportionately affect subsets of your users. In some cases, OOMs that overwhelmingly affect a given attribute can guide your mobile teams toward root causes.
After reviewing these high-level patterns, mobile teams want to dig into more specific datasets. In addition, they want to get closer to OOM groupings that they can take action on. After all, without stack traces to go on, what is the best way to isolate the root cause of OOMs?
Understanding the impact of OOMs across your views
Embrace provides metrics based on where OOMs are disproportionately impacting certain views within your mobile apps. That way, you can understand which views may be using too much memory so you can dive in and investigate. Here’s the data that Embrace provides:
- Event count – shows which views experienced the most OOMs
- Device count – shows which devices experienced the most OOMs
- Affected users % – shows which views have OOMs that are impacting the most users
- OOMs % – shows the percentage of OOMs that ended on a given view
- Overall % – shows the percentage of sessions that ended on a given view
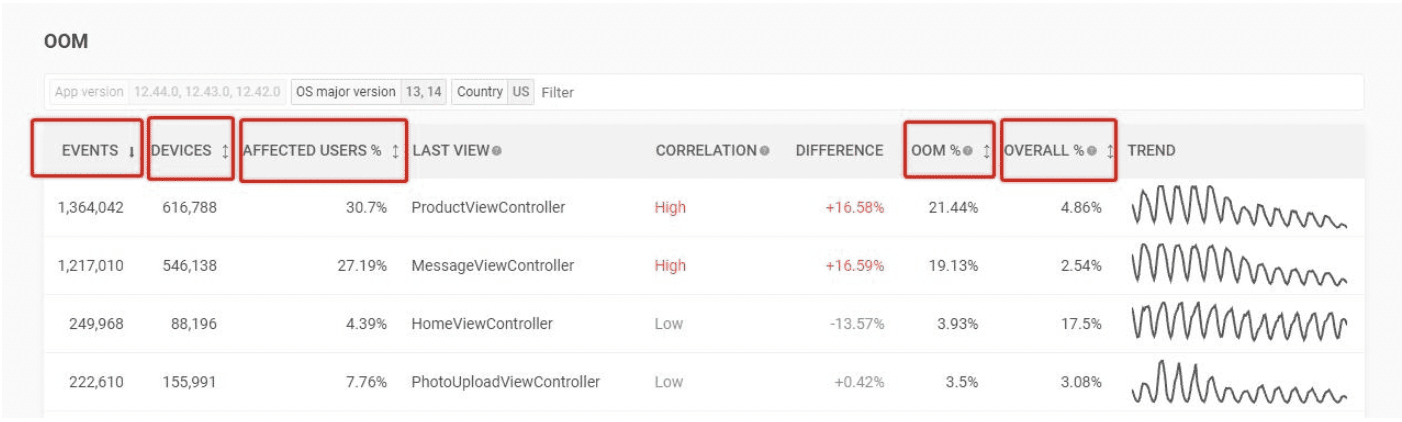
Your mobile teams can also leverage correlations that highlight potential problem areas within your mobile apps. Here’s how it works:
- Embrace knows which views the app is on when an OOM occurrs.
- Embrace also knows the baseline of how often a given view ends a session.
- If the OOM has nothing to do with the given view, these frequencies should be close to equal. However, large differences highlight a disconnect between the general usage of a view and how frequently an OOM occurs there.
What are some insights this approach provides?
- Get the actual user impact and not just raw numbers of events. If a large number of OOMs occur within your app, you want to know how many devices and users are affected. Maybe these OOMs are happening on old devices, to a few users, and it’s not worth prioritizing a fix.
- Identify big opportunities before investing engineering time. You want to focus engineering resources where they will have the largest impact.
- Understand the best place to find the root cause. If OOMs are happening frequently within a specific feature, you can have the feature owners investigate. Instead of blindly guessing, you’re pointed towards the most likely root causes automatically.
You can also refine your search by adding filters. If you are only interested in a particular country, device, build, etc., you can look at the exact dataset you care about to reduce the noise.
Now that you’ve chosen a view, it’s time to dive into actionable data to get you to the root cause.
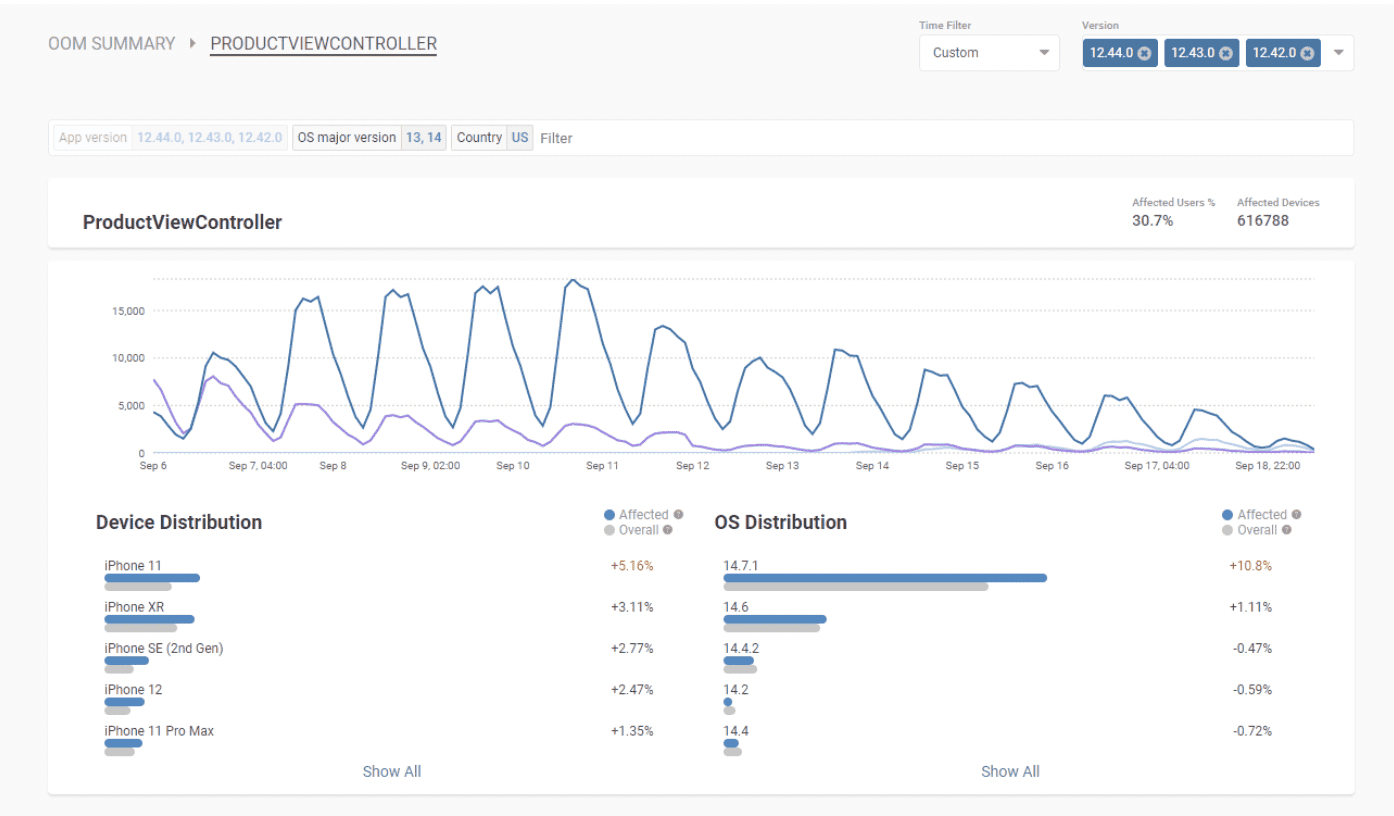
Inspect view-level metrics and distributions with Embrace’s OOM details page
Once you want to investigate a specific view, you head to the corresponding OOM details page, which provides many helpful metrics and visualizations, including:
- Percentage of affected users
- Count of affected devices
- Graph of OOM count by version over time
- Distributions across devices and OSs
Mobile teams can continue to add filters — your filters will persist across these pages — to drill down even further to find patterns worth investigating. Once you’re ready to inspect the affected user sessions, they are all available to you within this page. You can quickly scan the other issues that occurred during these sessions for additional context, such as network errors and bad key user moments. This is a great way to spot other failure types that contribute to OOMs.
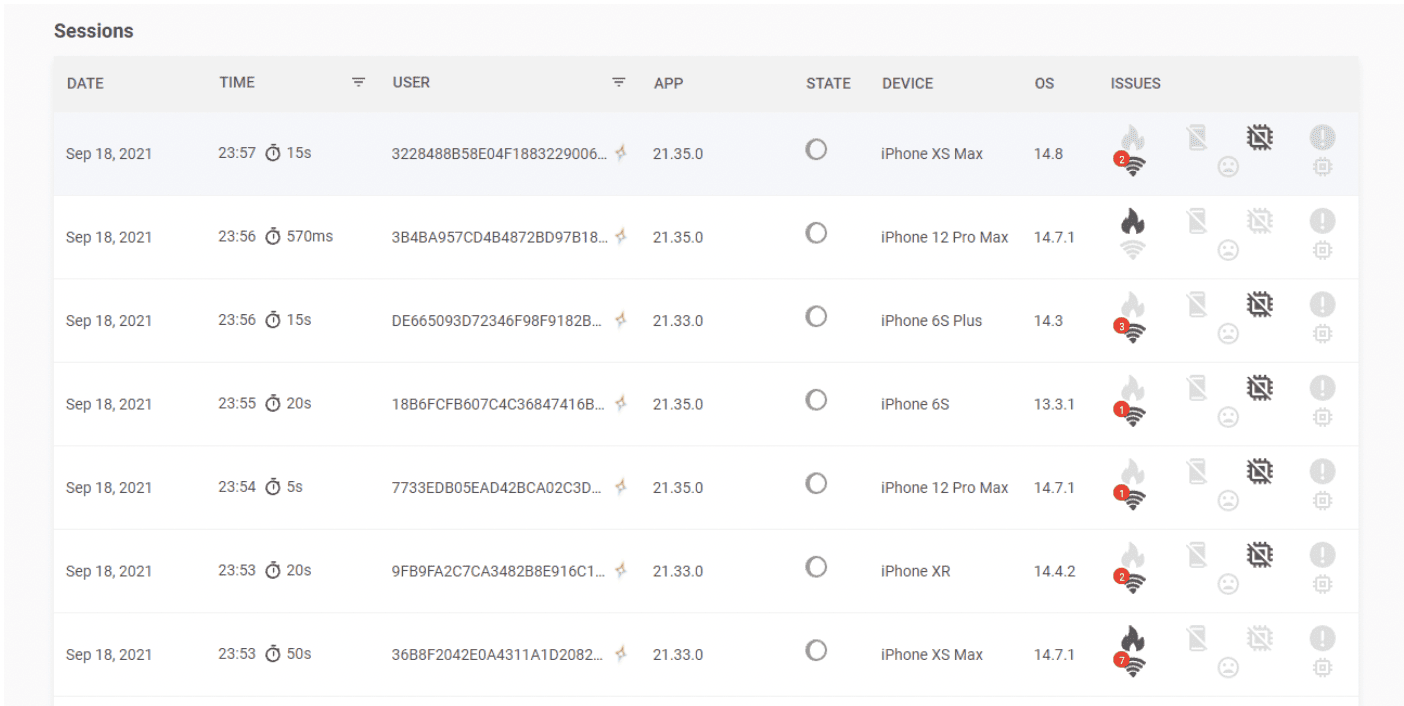
When your team is ready to inspect full session data, they can click into any individual affected session to review the complete user experience.
Dive into complete session details with Embrace’s user timeline page
In the Embrace platform, all roads lead to the user timeline, which highlights every technical event and user action within a session. It allows mobile teams to avoid manually reproducing issues by providing the full context of every user experience. Because Embrace collects 100% of sessions, you have complete data to understand an issue’s impact across your users and business as well as the underlying diagnostic data needed to remediate it.
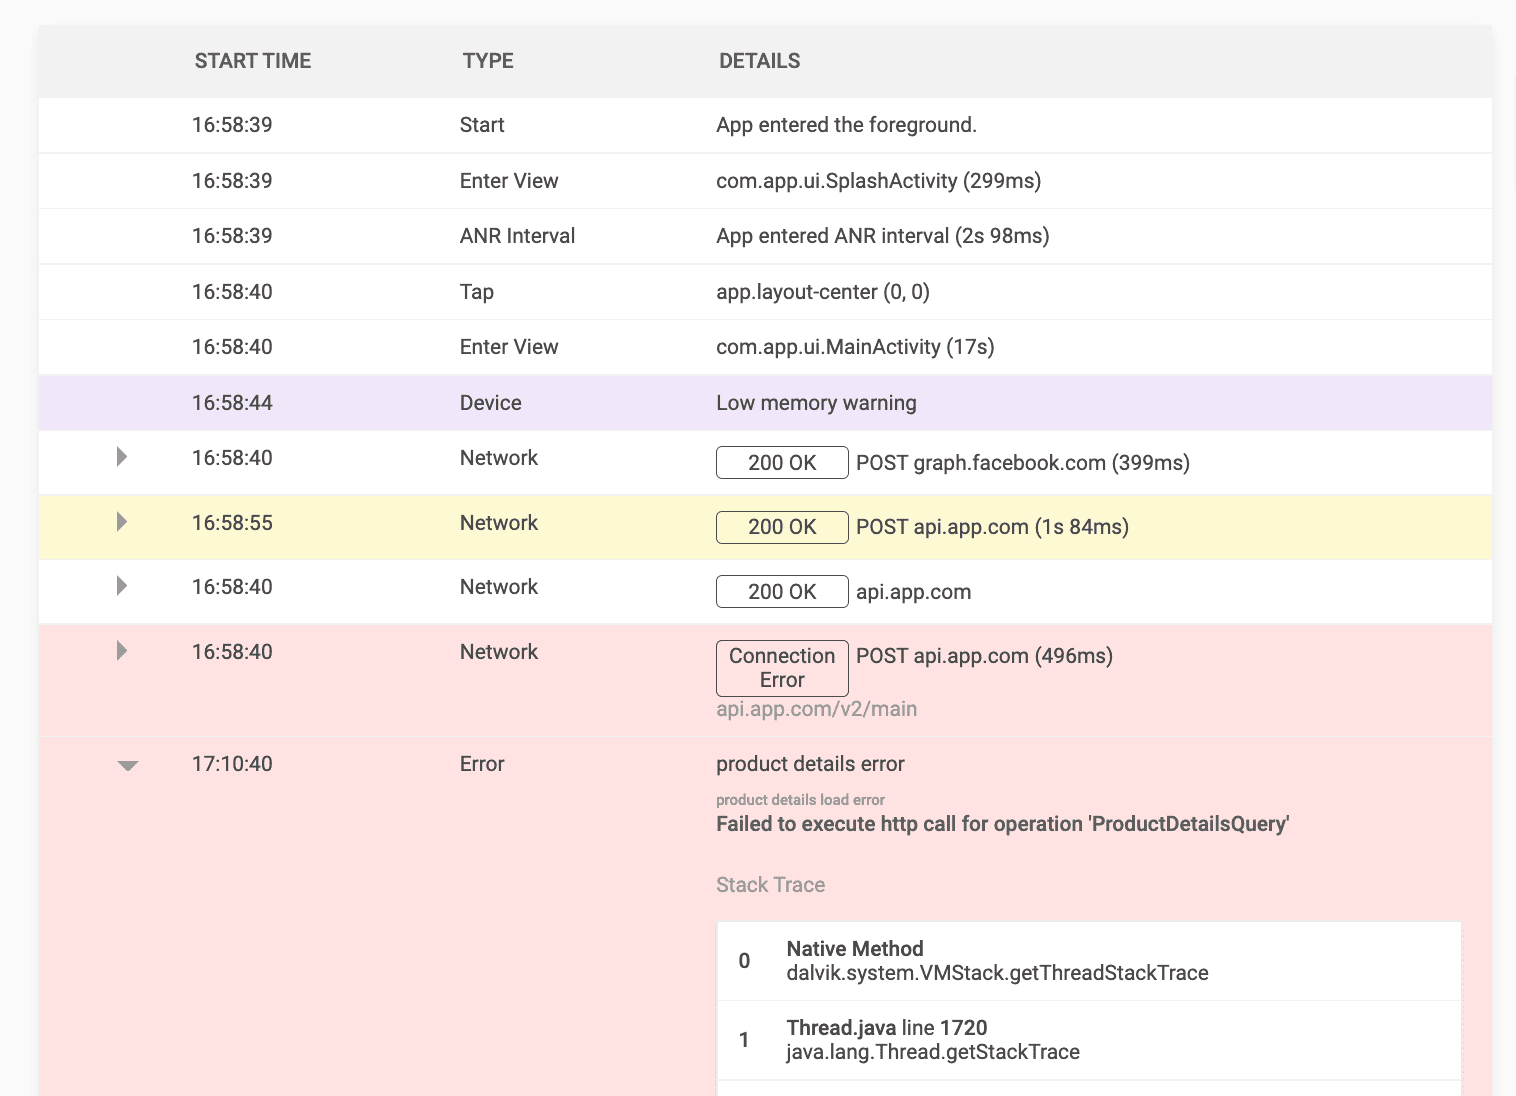
When solving OOMs, mobile teams can easily spot root causes within a User Timeline, such as:
- Loading too many images at once
- Loading excessively large assets like uncompressed images and videos
- Creating too many webviews without proper memory management
- Exceeding memory and CPU limits (which is visible by tracking device state changes)
- Network or code errors that result in corrupted data
- Loading too much data to/from disk
Once your mobile team can inspect the full details of what’s happening on the mobile device, they can easily pinpoint the root cause and put out a fix.
Summing it all up
With Embrace, mobile teams can solve OOMs by examining complete mobile user experience datasets as opposed to the limited data that event-based monitoring solutions provide. We’ve covered how teams can proactively address OOMs with powerful alerts and real-time dashboards. We’ve also highlighted how Embrace provides actionable insights across versions, devices, OSs, countries, and session properties, to name a few. Mobile teams have full visibility into the impact of OOMs across the views in their app, where they can immediately dive into the details of every affected user session to pinpoint the root cause. The end result is that mobile teams can identify, prioritize, and solve OOMs faster to minimize the impact on their users and business!
How Embrace helps mobile teams
Embrace is a data driven toolset to help mobile engineers build better experiences. With actionable data and insights derived from 100% of mobile user experiences, engineering and data science teams proactively uncover, prioritize, and instantly solve issues before they affect a business’ bottom line.
Want to see how Embrace can help your team grow your mobile applications with best-in-class tooling and world-class support? Request a demo and see how we help teams set and exceed the KPIs that matter for their business!
Get started today with 1 million free user sessions.
Get started free