
Most people currently monitor React Native performance with solutions that are not mobile-first. This approach is an issue because most solutions focus on the JS layer, but do not provide enough coverage for the native layer.
That means that any issues in the native layer won’t be accounted for, and you’ll still have blind spots in your app’s performance. Therefore, you need a holistic solution that covers both.
Embrace is the best-in-class React Native monitoring solution because our platform empowers mobile teams to uncover and solve issues that stem from either layer or that span both (e.g. a crash that occurs in both layers).
Here’s a brief intro to Embrace, and below, we will discuss the key metrics to track for your React Native app.
A Mobile Observability Platform That Tracks The Native AND JS Layer
Embrace is purpose-built for the needs of the modern mobile team. Our comprehensive platform surfaces the cause and impact of every issue (both known and unknown), alongside the actionable data and insights to solve them.
Unfortunately, providing visibility into every mobile issue is much easier said than done, so to achieve this goal, we built Embrace to be fundamentally different from traditional mobile monitoring tools. Here are a few key examples that highlight our unique value:
Track Every Session of Every User
Rather than collecting a sample of data, we collect 100% of the data from 100% of user sessions. This gives you the power to look up a specific user session, identify what led up to the issue (both technical events and user actions), and solve it without guesswork. This allows you to address issues faster, so if a negative review or social media complaint comes in, you can surface the issue, see its business impact, and have the data needed to fix it – all in one place.
Observability for Uncovering the Business Impact
With observability, you can uncover the impact of known and unknown issue types. You no longer have to guess how many users were affected by an issue, or how users with one particular variable (device type, geography, etc.) were affected versus total users. This is particularly useful when launching in new markets or comparing the performance and stability across specific segments like features, releases, or OSs.
Real-Time Data
You can see every session of every user in the Embrace dashboard mere minutes after the session occurred. Therefore, you can improve release monitoring by immediately pausing poor version rollouts, identifying customer complaint issues in real-time, and leveraging proactive alerts to prevent poor experiences.
Proactive Alerting
Real-time data makes alerts more valuable as you can proactively identify failing endpoints before users begin to complain. To succeed in the increasingly competitive mobile landscape, you need to deliver exceptional user experiences, and Embrace helps teams quickly respond to outages.
Now let’s jump into the metrics to monitor your React Native app’s performance.
Key Metrics to Monitor Your React Native App’s Performance
Crashes
Several failure types at the native layer feel the same as a crash to a user, but will not be reported as such. Therefore, users may tell you about crashes where the underlying issue could be any number of things that lead to a poor experience or app termination.
Some common crash-like issues include:
- OOMs
- ANRs
- Failing endpoints
- Blank screens
- Freezes
- Deep links leading to errors or dead end states
So if you’re relying on a crash reporting tool, not only will you not have this information, but you’ll also have no idea if it was a crash in the native layer or a separate issue altogether.
Fortunately, Embrace collects crashes from both the native and JS layer and uses both when calculating your crash metrics.
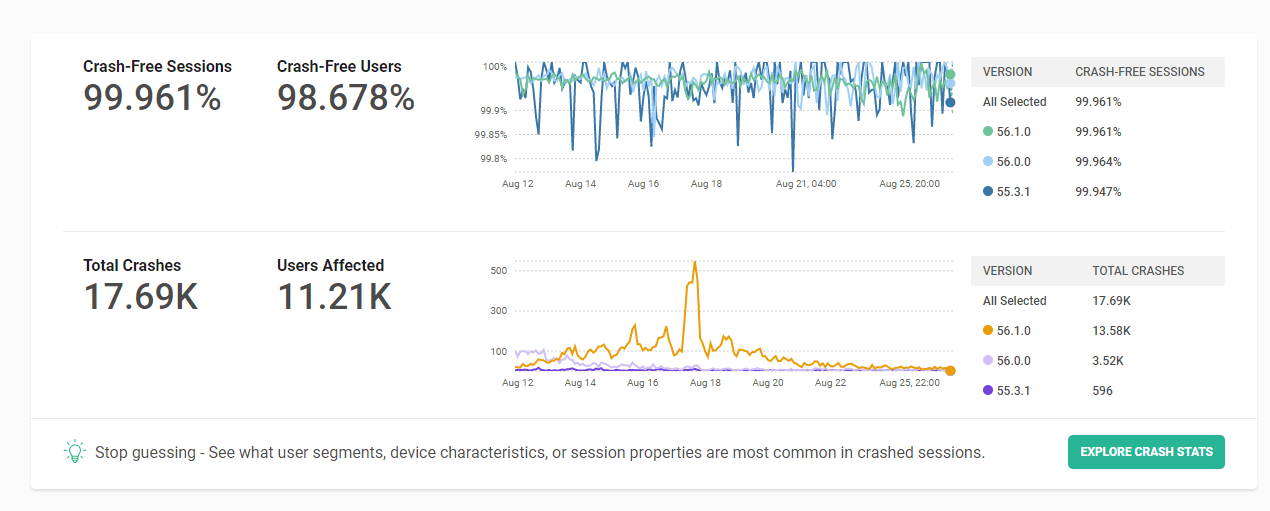
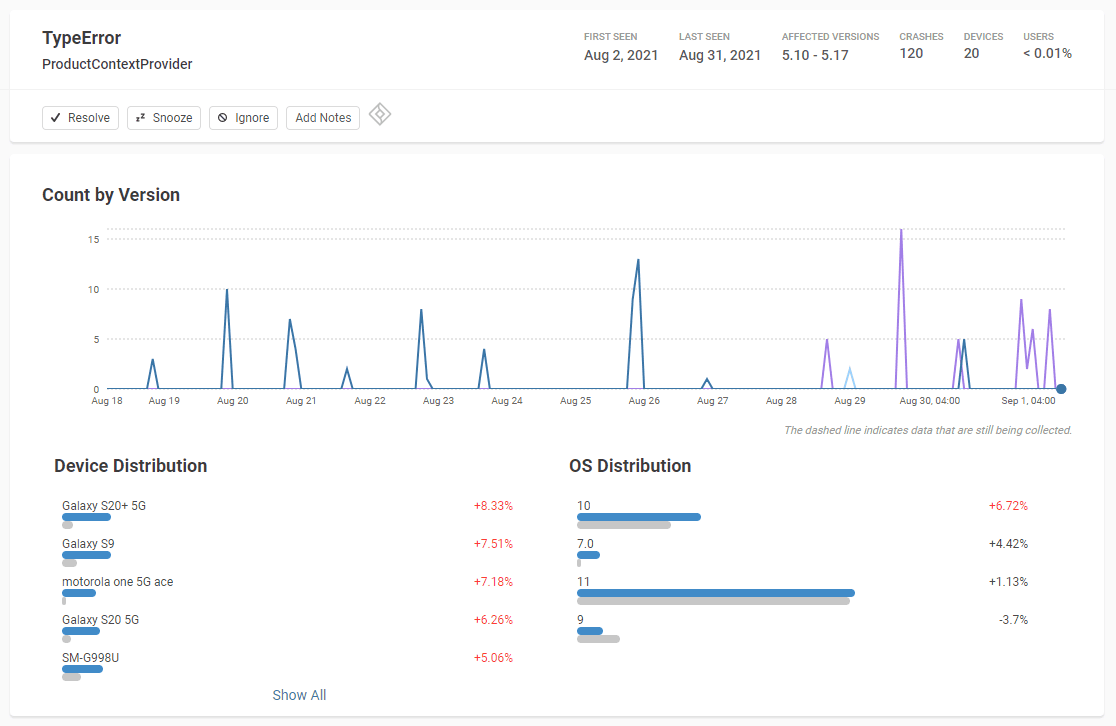
Your team also has access to extensive details when debugging both types of crashes, including:
- Full session details leading up to the crash, including views/screens, logs, network calls, device state, connectivity, and more
- Stack trace
- Counts and user percentages
- Device and OS distributions
Mobile teams need visibility into both native and JS layers to answer questions like:
- Was the issue really a crash?
- What caused the crash and where?
- How should we fix it?
Therefore, investing in a platform like Embrace will finally empower your mobile team to quickly and accurately identify crashes and technical errors that look like crashes.
App Health
If a user frequently encounters crashes or performance issues within the app, it won’t be long before they churn and develop a poor perception of your brand.
Therefore, you need a tool that can provide an accurate overview of the app’s overall health across the datasets you care about, such as:
- Versions
- Features
- Regions
- Devices and OSs
With Embrace, you can track app health with live dashboards and daily emails to ensure that your new features (and current features) are maintaining your performance and stability standards.
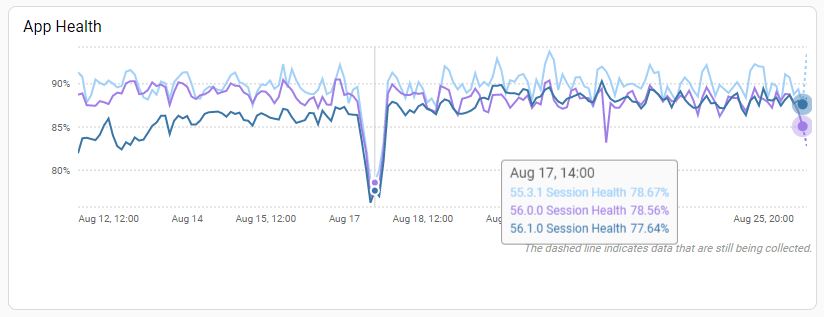
As Embrace tracks every session of every user, you not only have accurate metrics derived from a complete dataset, but you also can immediately investigate the affected sessions where regressions occur. These high-fidelity session replays allow you to reproduce issues on-demand. The faster your team can solve issues, the more time they can spend building features and growing the app.
Startup Time
Startup time is the duration of time that passes from when a user first clicks on an app to open it and when they are able to begin interacting with it. Nobody likes waiting for a slow app to load, and ideally, it should load in less than 2 seconds.
While most tools show you a median startup time, this data doesn’t provide an accurate picture of your performance. For example, it may show that the average startup time is 2 seconds, though there could be an issue in a certain region causing startup time to skyrocket to 15 seconds.
However, without detailed session data, your mobile team will never know that this issue exists, much less fix it.
To prioritize fixes, you also need to know how fluctuations in performance affect retention. For example, how many users will abandon the app if startup time increases from 2 seconds to 5 seconds? How many fewer times will they open the app?
If startup time increases from 2 seconds to 15 seconds, how quickly can you identify the culprit? Is there a failing third-party SDK? Is your app gracefully handling connectivity issues by getting the user to where they can interact?
Instead of staring at the single median startup time metric that a traditional APM solution would provide, Embrace allows your team to get to root causes faster by inspecting data across a wide variety of attributes.
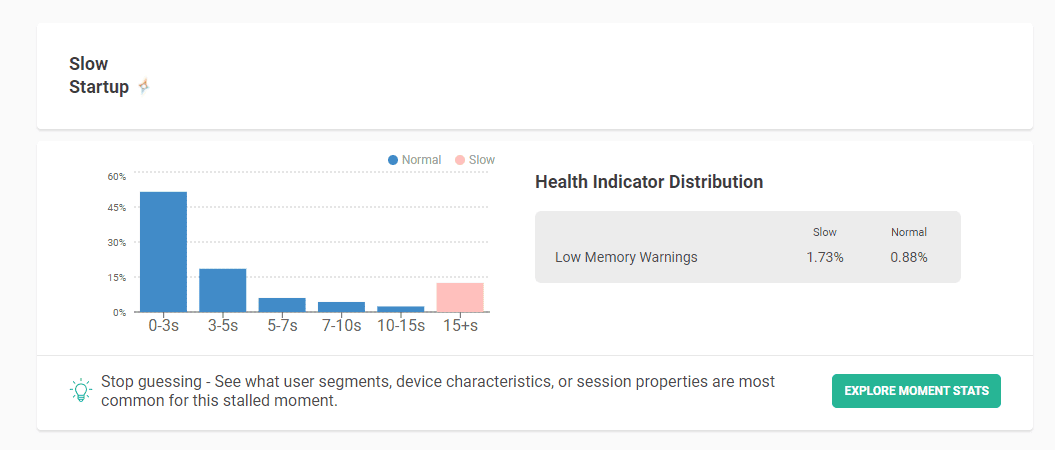
With Embrace, you’ll know the exact startup time for every user and therefore have accurate startup time metrics rather than ones based on sampled data.
You can group sessions by startup time duration to find patterns across slow experiences.
Equipped with this data, your team will be more efficient at identifying, diagnosing, and addressing high-priority startup issues.
Performance of Key User Flows
If you notice that a lot of users add an item to cart but don’t end up purchasing it, you might have a technical issue that results in slow experiences. In other words, there is no payment failure, yet users abandon the app in frustration. The outcome to your business is the same as if the app crashed on the user. Increasingly, the battle for brand loyalty and customer engagement comes down to speed. Can you deliver value to users faster than your competitors?
Here are a few examples of underperforming key moments that, if left unaddressed, will lead to churn and lost revenue:
- A social media app that takes too long to upload photos or add filters
- An e-commerce app that takes too long to load product details or complete purchases
- A messaging app that takes too long to send or receive messages
- An e-learning app that takes too long to load video
- A mobile game that takes too long to load the game or match players against each other
- A banking app that takes too long to request a loan or transfer money
So instead of wondering why users are dropping off, start tracking them!
Embrace allows your team to set performance timers around high-value actions within your mobile application, such as add to cart, checkout, and purchase.
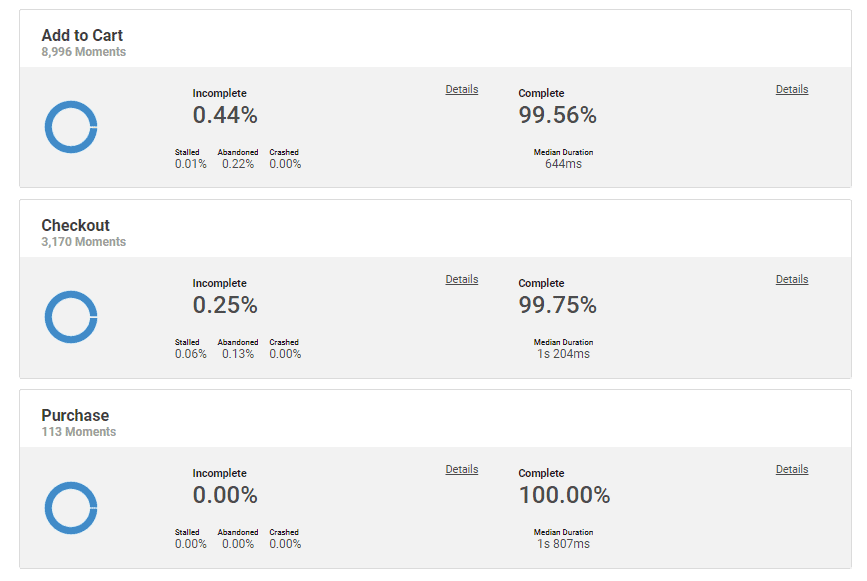
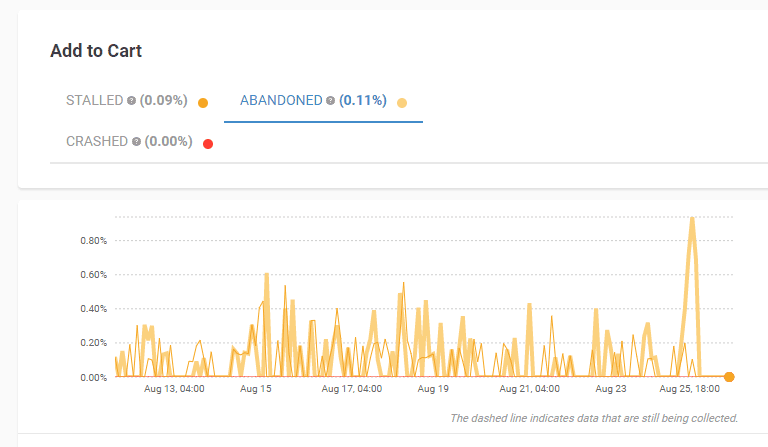
Once you’ve set these timers, they can provide insight into the thresholds users will tolerate before abandoning the app:
- Stalled – The user waited longer than a predefined threshold but the action did not complete.
- Abandoned – The user did not wait longer than the threshold, and the action did not complete.
- Crashed – The session crashed before the action could complete.
Armed with this data, the mobile team can set alerts for critical thresholds backed by data and allocate resources more efficiently to optimize app performance.
Network Call Performance
While some failed network calls are mere annoyances to the user, others (such as a failed purchase call) can prevent the user from buying your product altogether and directly impact company revenue.
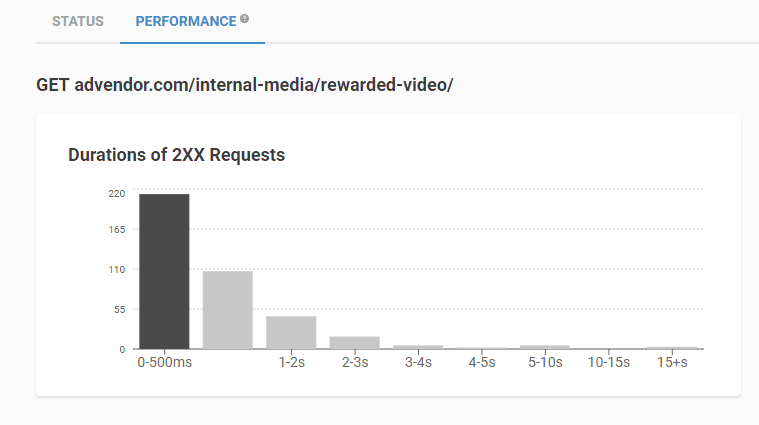
That’s why Embrace allows you to not only track network calls that failed but also:
- The time it takes a call to complete
- The error rates for these calls
- Connection errors that happen on the device
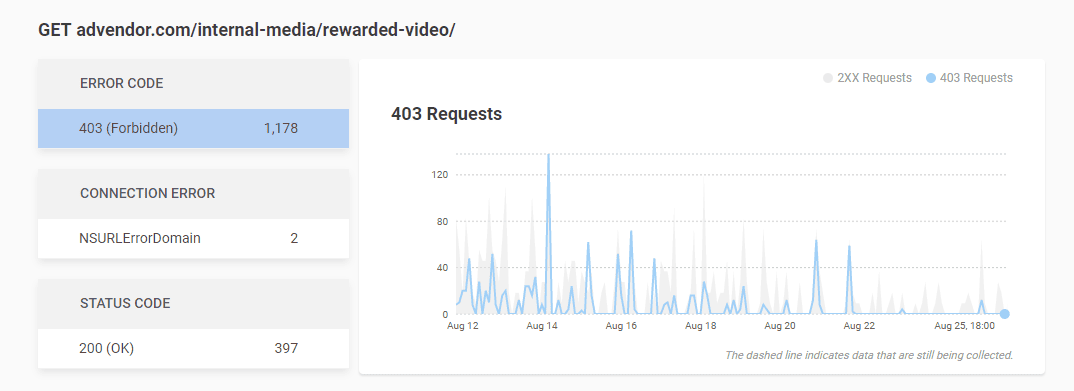
You can also set custom alerts such as a specific network call that fails X number of times. If you want to dig deeper on a particular failed network call, you can drill down to that specific user session for more context.
From a business perspective, this data is essential as network call issues that don’t result in a failure still provide a poor experience, and you’ll soon see users complaining that your app is painfully slow.
Here are a few examples of how pernicious slow network calls can be:
- Would you use a food delivery app that took 15 seconds to load a map?
- Would you use an e-commerce app that took 5 seconds to load details for a product?
- Would you use a hotel app if it took 10 seconds to unlock your door?
- Would you use a social media app if liking a post took 7 seconds?
By tracking latency device-side, your team can prevent slowdowns that erode engagement.
ANR Percentages
If your users are complaining about glitches and frozen screens, you are probably dealing with an ANR (application not responding) issue. They occur whenever the main thread is blocked, which results in users unable to meaningfully interact with the app.
Depending how long and frequent the freezes are, they can range from a brief annoyance to a major source of churn.
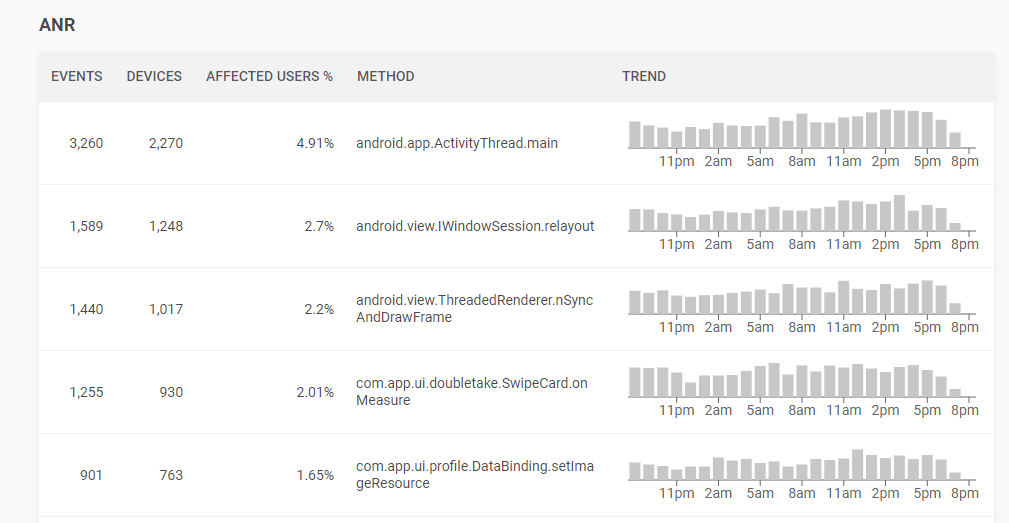
ANRs also hurt your Google Play Store ranking, so solving them will increase discoverability and organic installs.
However, an ANR percentage alone still leaves mobile teams in the dark with little information to take action and fix the problem.
That’s why Embrace provides extensive data to solve ANRs. Here are a few examples:
Teams can inspect stack traces for freezes that eventually recover. This allows for optimization across all slow areas to prevent frustration, rage taps, and force quits.
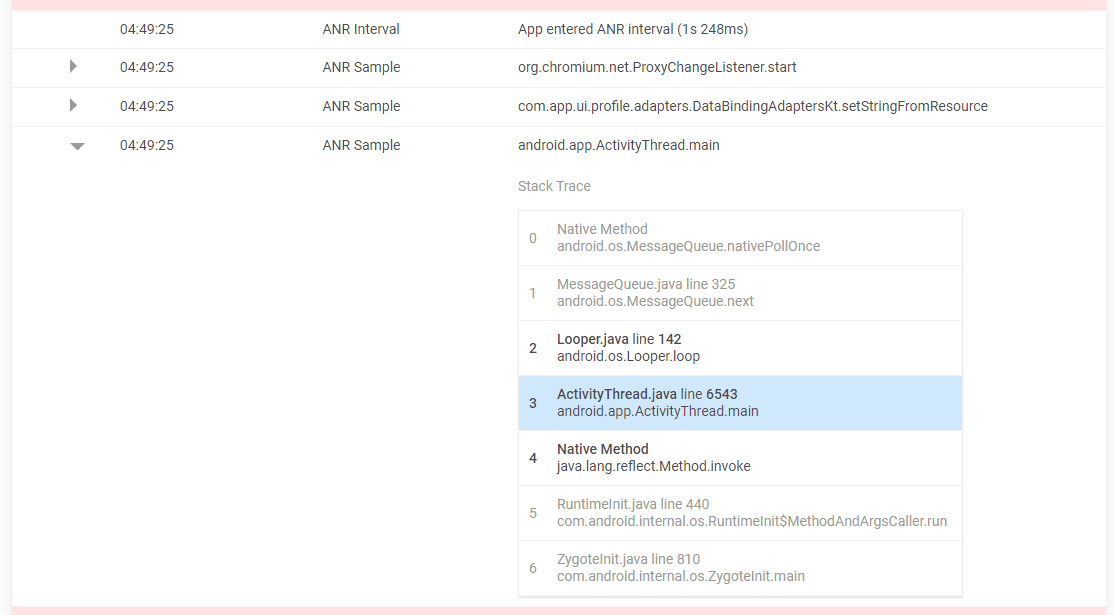
Teams can inspect stack traces from the entire lifecycle of an ANR. This differs from Google Play Console ANR stack traces that are taken when the user is prompted to terminate the app. With Embrace, your team can see what state the application was in when ANRs started and track how the code evolved throughout the freeze.
Teams can inspect stack trace flamegraphs to find the commonalities across ANRs. Instead of solving them on a case by case basis, teams can invest time where it will provide the most engineering return.
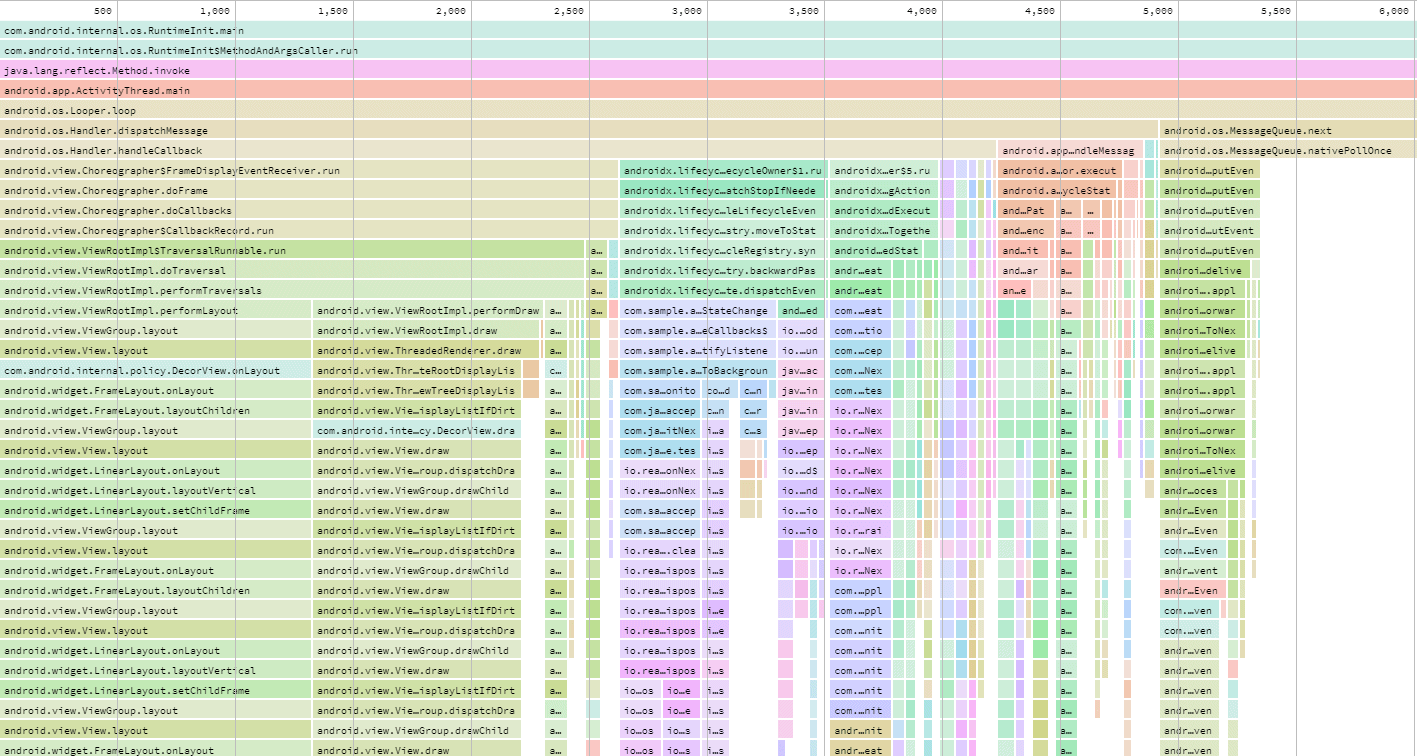
For more information, you can check out this post about ANRs.
Percentage of OOM-Free Sessions
Out of memory (OOM) issues are significantly more common than crashes. However, from the user’s perspective, both experiences are more or less the same. Therefore, many users report OOMs as crashes, which frustrates mobile teams as most apps with a 99.9% crash-free rate often have an OOM-free rate of 96-98%.
This is particularly common in social media and e-commerce apps because they are media-heavy. The downloading and processing of heavy images and videos can easily exceed system resource limits.
Mobile teams struggle to solve OOMs because on iOS they do not result in a stack trace. Even if your tool does show you the OOM score, it likely won’t provide information on which screens are disproportionately affected.
Ultimately, this leaves mobile teams in the same position as before they knew they had OOM issues as they have no data to solve the problem.
Therefore, Embrace collects data to show you not only your overall OOM score but also device and OS distributions for OOMs alongside full session details to guide debugging efforts. In addition, Embrace highlights correlations for which screens are most likely to be causing OOMs.
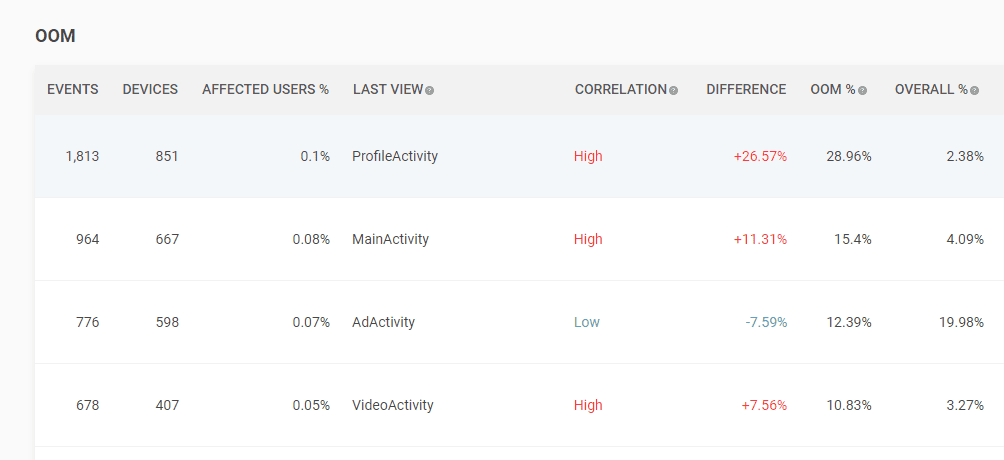
That way, mobile teams can track trends across screens, segments, and sessions to get to resolution faster.
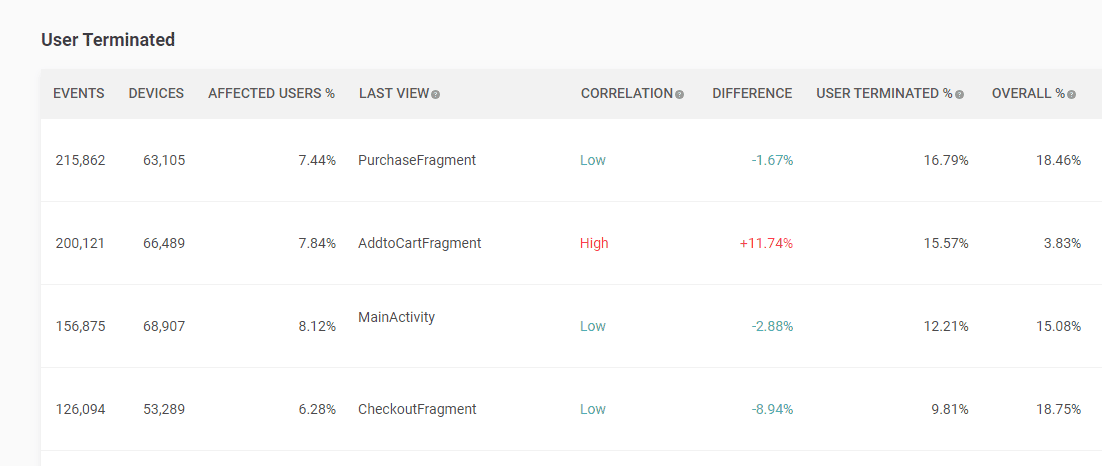
User Terminations
A user termination occurs when the user force quits an app by swiping up. While user terminations can happen for a variety of reasons (the user is done using the app, cleaning their phone, etc.), it’s still an important metric to track as it could be related to a technical issue.
A spike in user terminations in a particular part of your app might also signify a technical issue preventing users from continuing their session.
By tracking them across releases, features, regions, etc., teams can quickly dive in and uncover the technical failure leading to user frustration.
A spike in user terminations on a given screen could indicate:
- Failed ad loads are causing freezes.
- A broken button prevents users from navigating through a key flow.
- A server outage prevents users from logging in.
- A product detail screen loads too many images, leading to slowdowns.
With Embrace, you can track the percentage of user terminations occurring in your app, and even see the fragments, views, or screens that may be causing issues.
Choosing a React Native Monitoring Tool
Knowing that an issue exists in your app is only one step towards solving it. Mobile teams need data on what is causing the issue, where it is occurring, and what actions they should take to fix it.
That’s why Embrace’s approach is fundamentally different from traditional crash reporting or performance monitoring solutions. Mobile has so many variables that it requires high-fidelity session-level data to reliably uncover and solve issues in production.
Tracking individual events or metrics in isolation is a recipe for data that looks good but isn’t particularly actionable.
In contrast, Embrace collects 100% of the data from 100% of user sessions, providing true mobile observability. Mobile teams can surface a broader range of issue types and tie failures directly to the affected user experiences. The result is a more powerful way to gain visibility into the health of your mobile applications.
Embrace empowers mobile teams to make optimal business decisions through high-fidelity data and insights.
Want to know more? Request a demo today!
Get started today with 1 million free user sessions.
Get started free