
Editor’s note: Originally posted on Feb. 16, 2022, this blog has been republished on Feb. 28, 2023 to ensure all content and links are up to date and accurate.
Sentry is one of the most popular error handling technologies available, and it’s easy to see why. They offer many amazing benefits, including:
- Low friction to integrate: It’s open source, so developers can download and play around with it quickly.
- Breadth: Sentry supports a wide variety of languages and platforms, so teams can probably use it across their entire stack.
- Extensive integration options: You can integrate with other data visualization and session replay tools like Datadog, Splunk, Segment, Fullstory, and Asayer. In addition, they also allow you to integrate with notification and project management software like Slack, Trello, Teamwork, Asana, Microsoft Teams, Twilio, and more.
This post is for mobile teams that are evaluating options for monitoring the performance and stability of their mobile applications. While Sentry offers a mobile solution, its error reporting and performance monitoring features do not provide visibility into major user experience issues like:
- Frustrating screens that cause force quits.
- Slow startup times that lead to abandons.
- Issues that span across multiple user sessions.
- Missing elements such as blank screens and broken webviews.
- Failures stemming from the timing and order of technical events.
- Flame graphs to show the most common code execution paths across stack traces.
- Freezes and ANRs that are caused by blocking or excessive networking.
We’ll now go over the strengths and weaknesses of eight mobile monitoring solutions that make great alternatives to Sentry.
What can I use instead of Sentry error reporting?
You’ve got a few options when you’re looking for Sentry alternatives. Here are a few of the best.
Embrace
Embrace is a data-driven toolset to help engineers manage the complexity of mobile. Using automated data collection and a unified digital platform, Embrace reduces the toil of mining for insight across disparate tools. Engineers can identify, prioritize, and resolve problems in their apps, while also surfacing opportunities to perfect app performance and delight their end users. There are a few key reasons why Embrace is a great Sentry alternative, including:
- Complete mobile performance monitoring.
- Cheaper maintenance and implementation.
- Extensive support.
Complete mobile performance monitoring
Mobile teams using Sentry have limited performance monitoring. Specifically, they only have the ability to monitor crashes, error logs, and the timing of app startup and custom traces.
This is a major issue as you need to know the intersection of app performance and user behavior. That way, you can understand which poor user experiences result in reduced engagement, retention, and revenue. Examples include users abandoning slow startups, force quitting on frozen screens, and leaving slow purchase flows. Without seeing the technical and behavioral details together, mobile teams will lack context needed to identify the cause of poor user experiences.
With a tool like Sentry, you have to write a log for each issue you think could possibly occur. Since you cannot predict every issue in mobile, this results in a never-ending cycle of adding logs as new issues arise.
What’s worse, even if a log fired and you could look it up in Sentry, you still might not know how to fix it because you simply don’t have enough context around what happened leading up to the error.
Embrace identified this as a major problem and made our product an out-of-the-box solution that enables full visibility into all aspects of app performance. This is accomplished through the comprehensive nature of our platform. We collect 100% of the data from 100% of user sessions. That way, you don’t need to anticipate every failure point in order to get visibility when they happen.
With Embrace, you have guaranteed visibility every time:
- You can look up any user and review every single one of their sessions.
- You can get an alert and review every session that experienced whatever caused it.
- You can investigate any known issue and instantly replay every instance of it.
The benefit of high-fidelity data in mobile experience monitoring
Embrace is unique among mobile solutions because we never sample data. Our platform collects and transforms every session into traversable timelines that engineers can easily consume. No more manual issue reproduction. Instead, with the unsampled data you get from Embrace, you can reproduce any issue instantly in production.
By collecting 100% of the data from every user session, you have full context behind the lead up to any issue your users encounter. Ample session context like this is essential to improving mobile performance. That’s because knowing a crash occurred is one thing, but knowing why it occurred — and having the data to fix it — is entirely different. A tool like Sentry that samples data will let you know that the crash occurred, but it can’t necessarily isolate an individual user session for further analysis like you could do with Embrace’s unsampled data. User session analysis helps your mobile team see:
- Technical events like logging errors or the timing of network calls.
- Behavioral events such as views, screens, taps, and button presses.
- The device state which includes factors like CPU, connectivity, battery life, and memory.
- The session outcome whether that ends in an exit, ANR, crash, or force quit.
Session-based monitoring provides your mobile team with high-fidelity data that allows them to solve issues efficiently and without guesswork.
How to use the knowledge that 100% of user sessions provides
When you have access to 100% of user sessions, you know 100% of the impact. Instead of guessing at the true impact of an issue with a sampled dataset like Sentry, you can immediately know whether an issue demands your attention.
For example, a personalized video company was previously a Sentry customer, and they knew that they had a crash affecting some users. However, the sampled data made it seem as though it only affected a small handful of users, so they didn’t prioritize fixing that crash.
It wasn’t until they started working with Embrace that they realized that it affected nearly 2% of users. They learned the true impact, and they quickly prioritized and solved it with Embrace’s high-fidelity data.
Needless to say, knowing about crashes isn’t the only information your mobile team needs. They also need to know about issues that don’t result in crashes, the context in which these issues occur, and a precise measurement of how many users are affected.
Solving issues beyond crashes
Here is a great example of how Embrace helps solve non-crash issues that traditional mobile solutions would not provide visibility into:
An education company received complaints from users about being unable to login to the mobile app. There were no associated crashes or errors. With Embrace, the mobile team uncovered that the login issue was due to 1% of subscription purchases silently failing.
By looking up affected user sessions, they noticed that two key network calls in the purchase flow were firing out of order. And even though they were both completing successfully, the order was preventing the purchases from going through.
Users received no error message, and mobile engineers had no obvious failure to investigate.
With Embrace’s comprehensive session-level detail, mobile teams can uncover and solve every type of issue, even ones that elude logs and crashes.
Cheaper maintenance and implementation
Sentry is open source and relatively easy to download and get started, though it doesn’t offer automatic instrumentation.
Instead, your engineers will have to manually build up visibility by adding individual logs, and as new issues arise, you’ll need more and more logs.
This will result in wasting time and money. First, the mobile team will waste money by tasking expensive engineers with managing a tool. Instead of having a solid platform with minimal maintenance, engineers will need to be pulled off the roadmap to upgrade and extend Sentry. Second, the mobile team will waste time by having to add logs and wait whenever new issues surface. Instead of knowing they solved the root cause, they will have to spend release cycles confirming a fix, or worse, adding logs just to build visibility.
In contrast, Embrace collects 98% of events in every user session out of the box, without the need for further integration. Specifically, here’s what an out-of-the-box integration gets you with Embrace:
- Views/activities
- Network calls
- Crash reporting
- Freeze and ANR detection
- User terminations
- App performance
- Custom real-time dashboards
- Proactive alerting
If you want to go even deeper, here are some additional options you can leverage:
- Logs and breadcrumbs. These provide additional information and can be added as needed.
- Setting first party network calls. Out of the box, Embrace collects every network call from every session. By specifying first-party domains, you can segment them into first and third-party ones.
- Key user flows. Embrace intelligently detects startup time and captures this immediately. However, you can customize it to suit your application. You can also set up monitoring for things like add to cart, checkout, and purchase to track the timing and abandonment/failure rates of key moments in your app.
An added benefit of an out-of-the-box solution like Embrace is that it’s easy to onboard new engineers. With Sentry, integrations can get messy over time, so new engineers will need time to understand the nuances of custom setups. However, the Embrace dashboard is incredibly intuitive, meaning new engineers can onboard and begin investigating issues within minutes.
Extensive support
Sentry was originally a free open source platform, and while they have added paid versions, their approach to customer success hasn’t changed much.
On many of their plans, if you have a question, your only option is to submit a customer support ticket. In contrast, Embrace approaches each customer as a partner.
Therefore, in addition to support via email and Slack, you will also have check-in calls with a customer success manager to help you meet your KPIs. They will provide insights into your mobile app, including benchmarking performance against competitors, pulling custom data, and coaching on how to best make use of the Embrace platform for issue resolution.
For example, one of our customer success representatives helped an e-commerce client set up proactive alerts for Black Friday and Cyber Monday.
One of those alerts detected a server outage in the curbside delivery program, which notified the developers in real-time and allowed them to push out a quick fix, saving the company hundreds of purchase orders.
In addition, since each mobile application is different, we offer help every step of the way when instrumenting advanced Embrace features. If you’d like to see how complete mobile visibility can revolutionize how you deliver incredible mobile experiences, get started with a free trial today.
Why Embrace may not be a great Sentry alternative
While Embrace is an ideal solution for many mobile-first companies, we aren’t the best fit for everyone. Specifically, here are some reasons Embrace might not be right for you and your team:
- We are mobile-only. Mobile is so unique that it requires its own platform in order to uncover the insights needed to solve the toughest issues. If, for whatever reason, you need one tool for everything, Embrace is not your solution.
- We do not currently support Xamarin, Ionic, or Cordova. We support mobile applications built in native iOS and Android, React Native, Flutter, and Unity.
- We are not built for web. If you include webviews in your mobile application, we collect and provide valuable information on them, but we are not the solution for web apps themselves.
Rollbar
Rollbar is an error tracking tool that supports Android and iOS and they claim to show you (in real-time) when errors occur and how to fix them.
Here are some of their key features:
Real time error reporting
Once you have the tool set up, Rollbar will send you an alert as soon as an error occurs. Their dashboard also groups all errors by root cause to reduce the time required to fix them. You can also click into each error to access key data regarding the error.
Error logging details and metadata
Another key element that Rollbar offers is error logging. For example, you can log a warning, error and info level message, and it also gives you the information you need to replicate and debug an error.
Rollbar also shows valuable data like stack traces, local variables, affected users/IP addresses, and more. It works with ProGuard obfuscations for Android and iOS Symbolications for iOS.
Timeline
Rollbar also offers a timeline of events that occurred prior to the error. This helps developers uncover what caused the error and enables them to fix it faster.
Pricing
All of their pricing is based on events. So if you have under 50,000 events, the price is $21 per month and 50,000-100,000 events is $82 per month. Beyond that is enterprise pricing.
Raygun
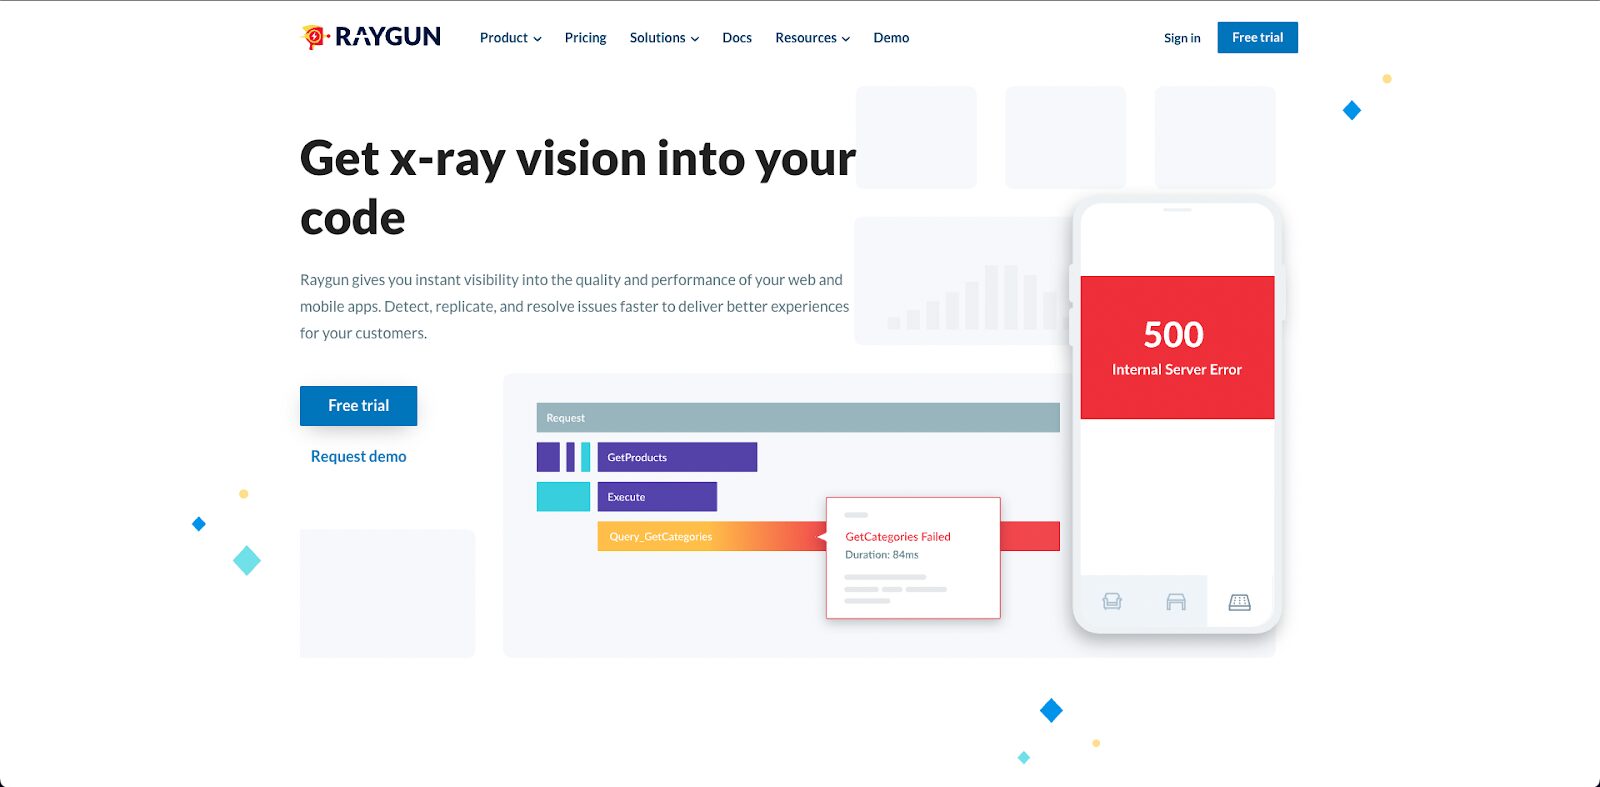
Another Sentry alternative that provides extensive mobile error tracking and performance monitoring is Raygun.
The two most significant features they promote for iOS and Android are real user monitoring and crash reporting.
Error monitoring and crash reporting
Raygun’s dashboard allows you to see an overview of errors by hour and active, resolved, and ignored errors.
You can also see how many users each error affected and how many times it occurred (for example, if it occurred to one user three times).
To help you solve crashes, they also track breadcrumbs of events that lead up to the moment of the crash.
Real user monitoring
In addition to monitoring crashes, they also monitor performance. For example, they offer several dashboards that provide an overview of the average time it takes to complete API calls, queries, and more.
They also provide instance-level diagnostics on every page requests so that you can analyze your app’s performance for every user session.
If you want to integrate it into your organizational workflow, you can do so through Slack, GitHub, and Trello.
Pricing
They price each feature separately. For example, error monitoring starts at $4 per month for 10,000 events whereas real user monitoring and application performance monitoring is $8 per month for 10,000 events.
AirBrake
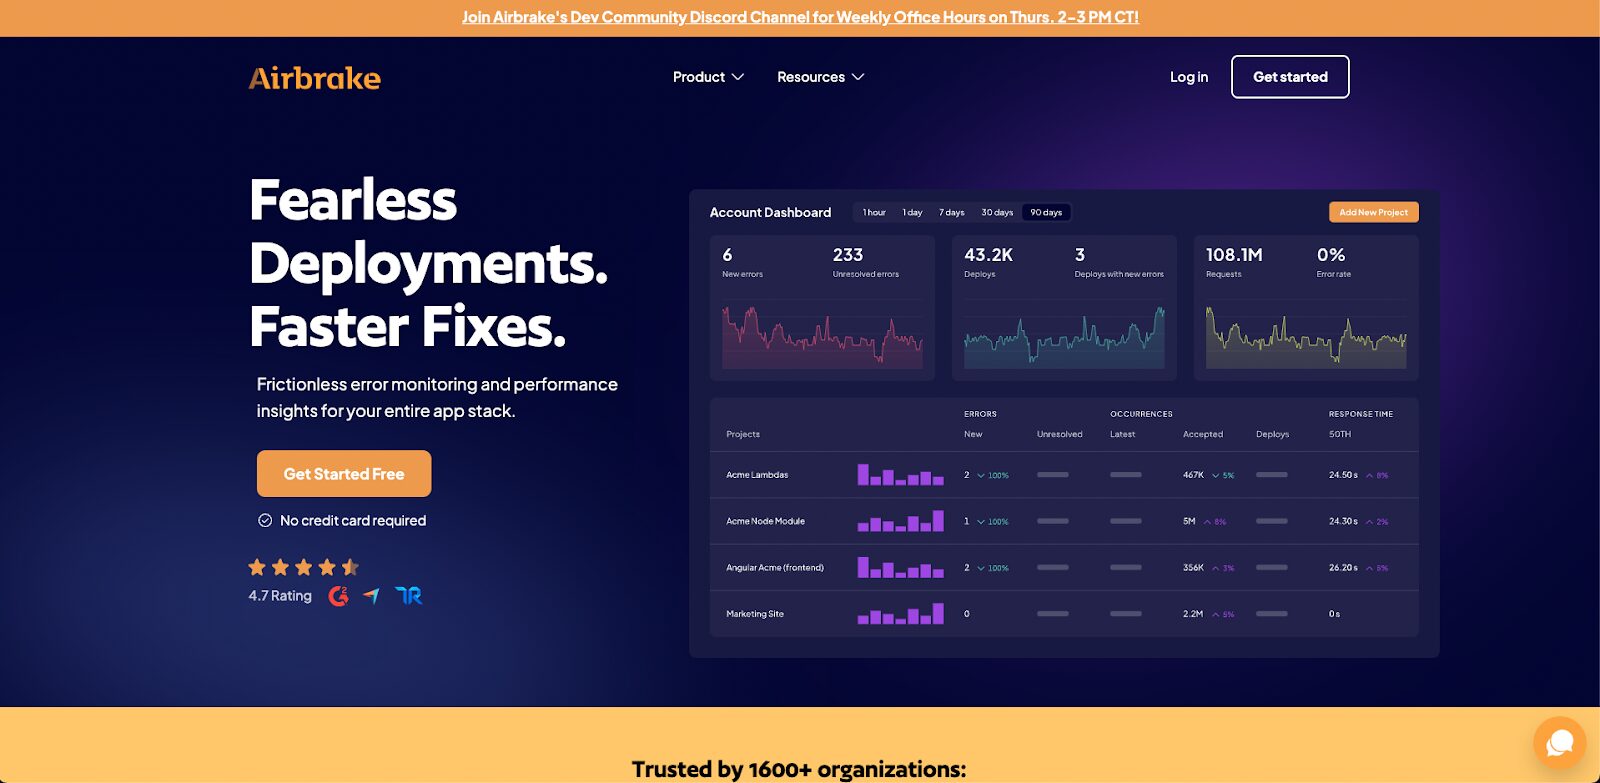
AirBrake is another Sentry alternative that is designed for smaller businesses that just need a simple tool for tracking bugs.
They support Android and iOS and offer basic information on each.
Airbrake’s main debugging feature is their ability to show stack traces alongside a list of events that happened before the failure. However, they don’t offer detailed information on things like performance issues.
In their dashboard, you can see an error message as well as when the error occurred and how often. They also offer search and filter functions that make it easy to sort errors by timeframe or specific attributes/characteristics.
Pricing
They have five pricing tiers based on the number of errors you have. It starts at $17 for up to 25,000 errors and up to $719 per month for up to 5 million errors.
Datadog
Finally, if you’re looking for a Sentry alternative that will quickly detect and resolve mobile application issues, Datadog is an excellent choice.
They support Android and iOS and offer the following key features:
Performance monitoring
Datadog Mobile Real User Monitoring (RUM) has out of the box dashboards to track things like screen load times, which screens return the most errors, and which resources are the most requested. You can also create custom dashboards to track business-specific metrics.
This is far more in-depth than most other platforms that just offer basic information like slow startup times.
You can also filter across several attributes, including geography, OS version, and device, to investigate how issues are affecting specific user segments.
Error management
Error management allows you to monitor errors and crashes and set up automated alerts to be notified of spikes.
You can also filter data to identify errors impacting a specific environment to make it easier to solve the issue.
By integrating Mobile RUM with Datadog APM, you can also inspect the timing and outcome of traces from device-side to server-side. That way, if a request results in an error, you can review the preceding calls to search for the root cause.
User actions
Datadog Mobile RUM provides analytics such as user geography, most visited screens, and most used OS versions. You can also see user actions such as taps and scrolls in a helpful list so you can have a better idea of what actions users are taking within your mobile application.
By reviewing individual user journeys, you can spot opportunities for UI improvements that will improve the overall user experience.
Pricing
They offer various pricing plans with the pro plan at $15 per host per plan monthly and the enterprise plan at $23 per host per month.
Instabug
Instabug is another Sentry alternative that supports Android and iOS.
Its main features are user bug reporting, crash reporting, app performance monitoring, and user surveys.
They also have their own App Performance Index Score (Apdex) which is calculated based on:
- Crashes
- App launches
- App traces
- Network calls
- UI hangs
Let’s dive into their specific features.
Bug reporting
Users and testers can report a bug from within the mobile app, which simplifies the collection of immediate user feedback. The user can also add their own annotated screenshots, voice notes, or even screen recordings. The bug report contains the UI interactions (views, taps, scrolls) and the log of network calls.
Crash reporting
Instabug offers basic crash reporting such as the percentage of affected users (based on a sample), the number of crashed sessions, and the app versions impacted.
App performance monitoring
As for performance monitoring, they look at startup time, network call latency, UI hangs, execution traces, and their own Apdex (a ratio of good to bad sessions).
User surveys – in-app targeted surveys
User surveys allow users to provide feedback on their in-app experience. So if they encounter a bug, they can report it themselves. Essentially this enables business owners to:
- Create custom surveys based on OS, device, number of sessions, etc.
- Ask users that responded positively to leave a review in the app store
- Inform users of new features in the latest version
- Ask users on outdated versions to update
Pricing
Instabug only offers bug reporting out of the box on basic and pro tiers. If you want crash reporting, APM, and user surveys, you will have to pay extra (which is sometimes more than the tier itself).
Enterprise pricing kicks in at:
- 500,000 Sessions/Month
- 500 Bug Reports/Month
- 5M Performance Events/Month
Firebase
Firebase is perhaps the most widely known and used Sentry alternative as it’s a free tool owned by Google.
Within their dashboard you get basic crash reporting, though you won’t be able to drill down to full individual user sessions. For a given crash, you can review the stack trace, device information, and some additional logging (e.g. custom keys, custom logs, user identifiers, and caught exceptions).
They also don’t offer any kind of support out of the box, so if you come across an issue, it’s up to you to solve it.
In addition, Firebase can take up to 24 hours for data to show up, so if you have a major feature launch and there is a bug, you won’t know about it until the next day.
Pricing
The bonus with Firebase is that it is a free tool for crash reporting and performance monitoring.
New Relic
New Relic is a performance monitoring platform that prides itself on its all-in-one capabilities. A few of their features include:
Full-stack offerings
New Relic’s all-in-one capabilities refer to their full stack offerings. With this platform, you can get all your application, infrastructure, log management services, and other observability data in one place. That also includes mobile data, but it should be noted that New Relic’s core competency is on the backend and therefore their mobile data is limited. While it can be added on for an additional fee, many choose to integrate existing mobile monitoring solutions into their New Relic instance.
AI capabilities
This Sentry alternative offers an AIOps feature that automatically gathers certain insights. New Relic’s artificial intelligence feature helps reduce noise in data that makes altering less effective and negatively impacts incident detection and resolution.
Ample integrations
New Relic has over 500 out-of-the-box integrations so it’s compatible with a variety of team needs.
Pricing
There are three different pricing tiers Standard, Pro, and Enterprise. Standard is free, although limited to 5 full-platform users. The Pro and Enterprise editions require custom pricing.
Choosing the best Sentry alternative
Sentry is an excellent error tracking solution for many use cases. For teams that want a single tool across multiple languages and platforms, it can provide visibility into crashes and errors.
Modern mobile teams that need high-fidelity data may want to consider more full-fledged alternatives. For companies whose revenue increasingly stems from their mobile offerings, it’s important to empower your mobile teams with tooling that’s built for their needs. This means equipping your team with a tool that:
- Maintains velocity and creates opportunities to remove friction.
- Gives full visibility into both technical and behavioral metrics.
- Gathers data on, and allows you to reproduce, every user session for more efficient problem solving.
- Is backed with industry-leading support.
If a platform like this aligns with your team needs and goals, learn how Embrace can help you deliver incredible mobile experiences by starting a free trial today.
Get started today with 1 million free user sessions.
Get started free