At Embrace, we are passionate about our ecosystem and providing our users with the freedom to choose where their mobile data is visualized and analyzed. Today, we’re excited to announce our newest partnership and plugin with Grafana – a popular open source data visualization solution for every database. With the Embrace data source plugin for Grafana, mobile teams have an easy way to visualize Embrace mobile metrics data directly in Grafana to get a real-time view into their mobile app health and performance alongside Grafana’s 300+ plugins.
Achieve end-to-end visibility across backend, web, and mobile
By using Embrace with Grafana, mobile engineers can now share deep mobile context in real-time with SRE, DevOps and platform engineers to eliminate blind spots from missing mobile data and truly gain full stack mobile app observability across frontend, backend and everything in between. The Embrace plugin for Grafana gives teams a real-time view into your mobile app performance including crash sessions, deployment tracking, and the overall health and trends of your mobile app. Engineering, Product and DevOps teams can seamlessly correlate Embrace metrics alongside their existing data in Grafana, such as relevant logs, infrastructure health metrics, and other telemetry from your app’s dependencies. With end-to-end visibility, teams can improve cross-team collaboration, identify issues and get to the root cause faster, ultimately improving the end user experience.
Quick time to value with easy install and out-of-the-box Embrace dashboards
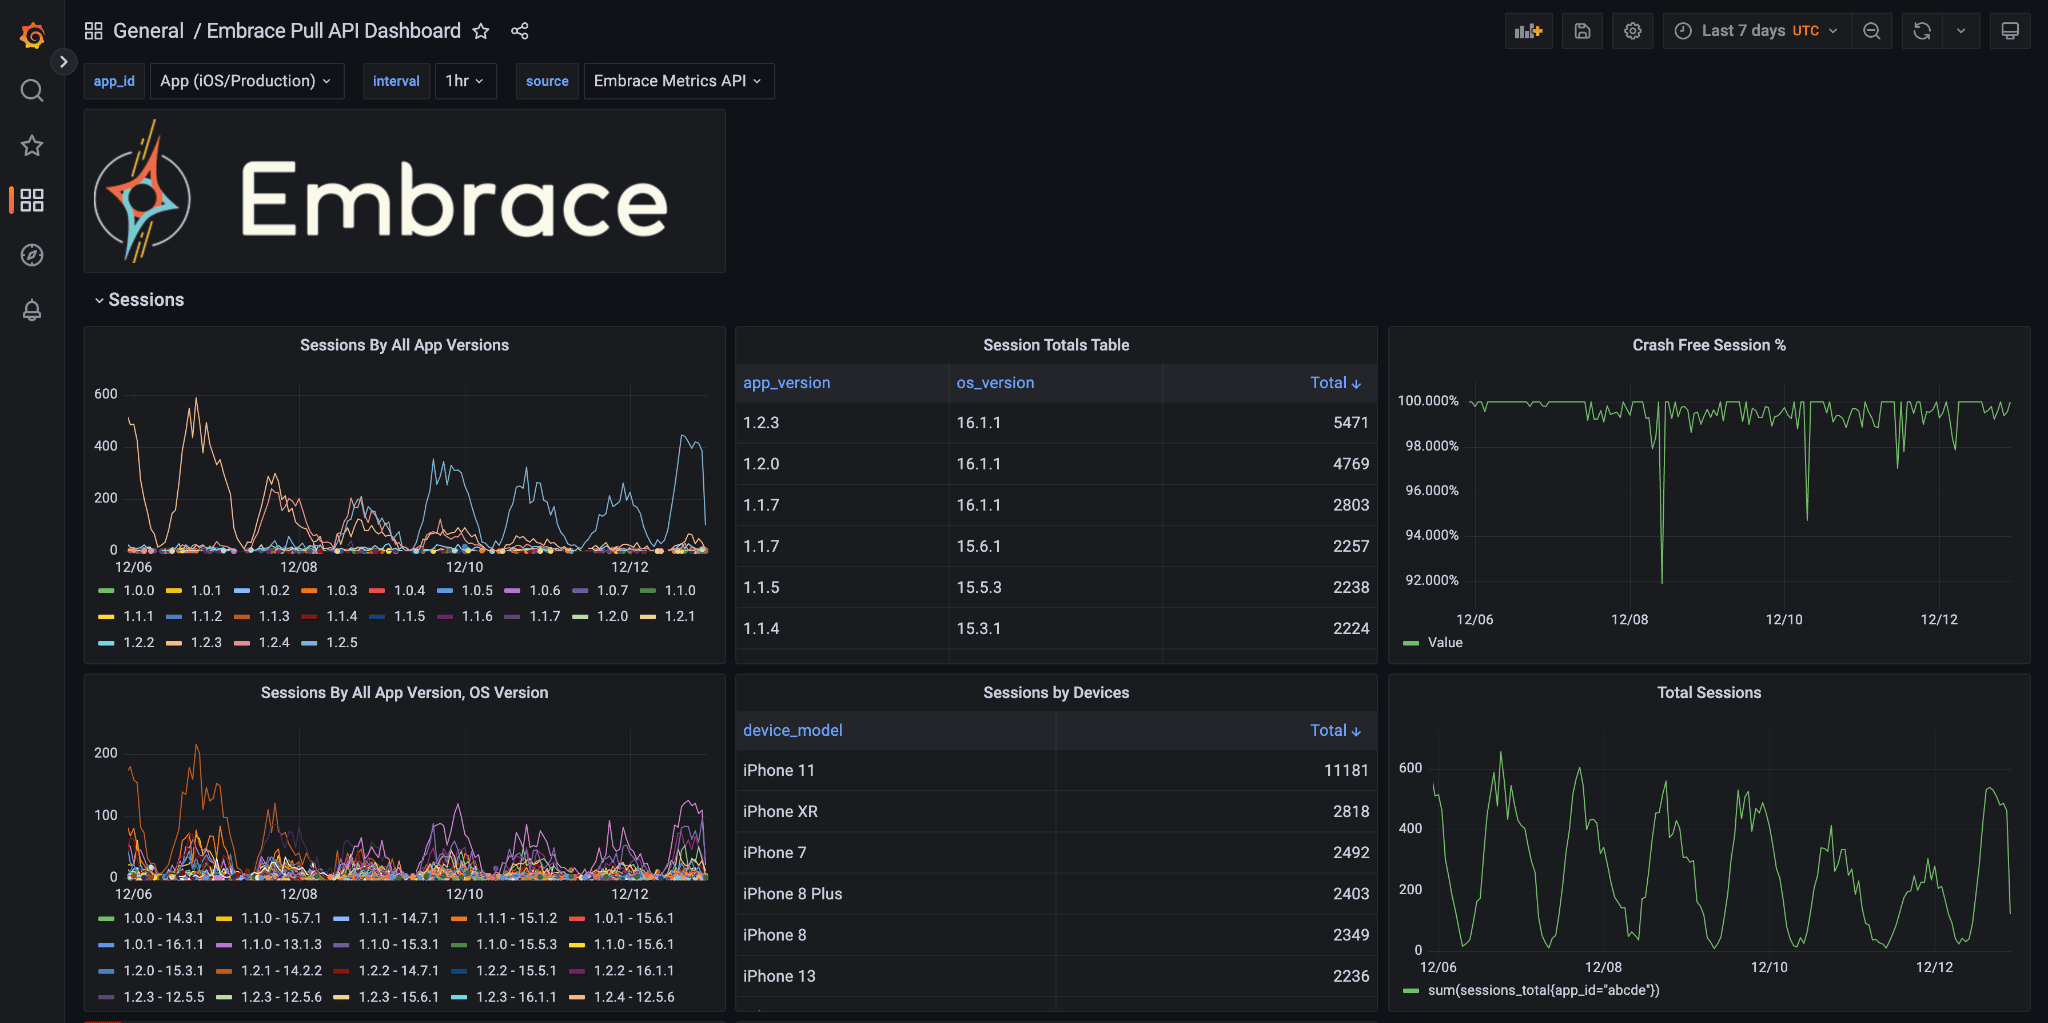
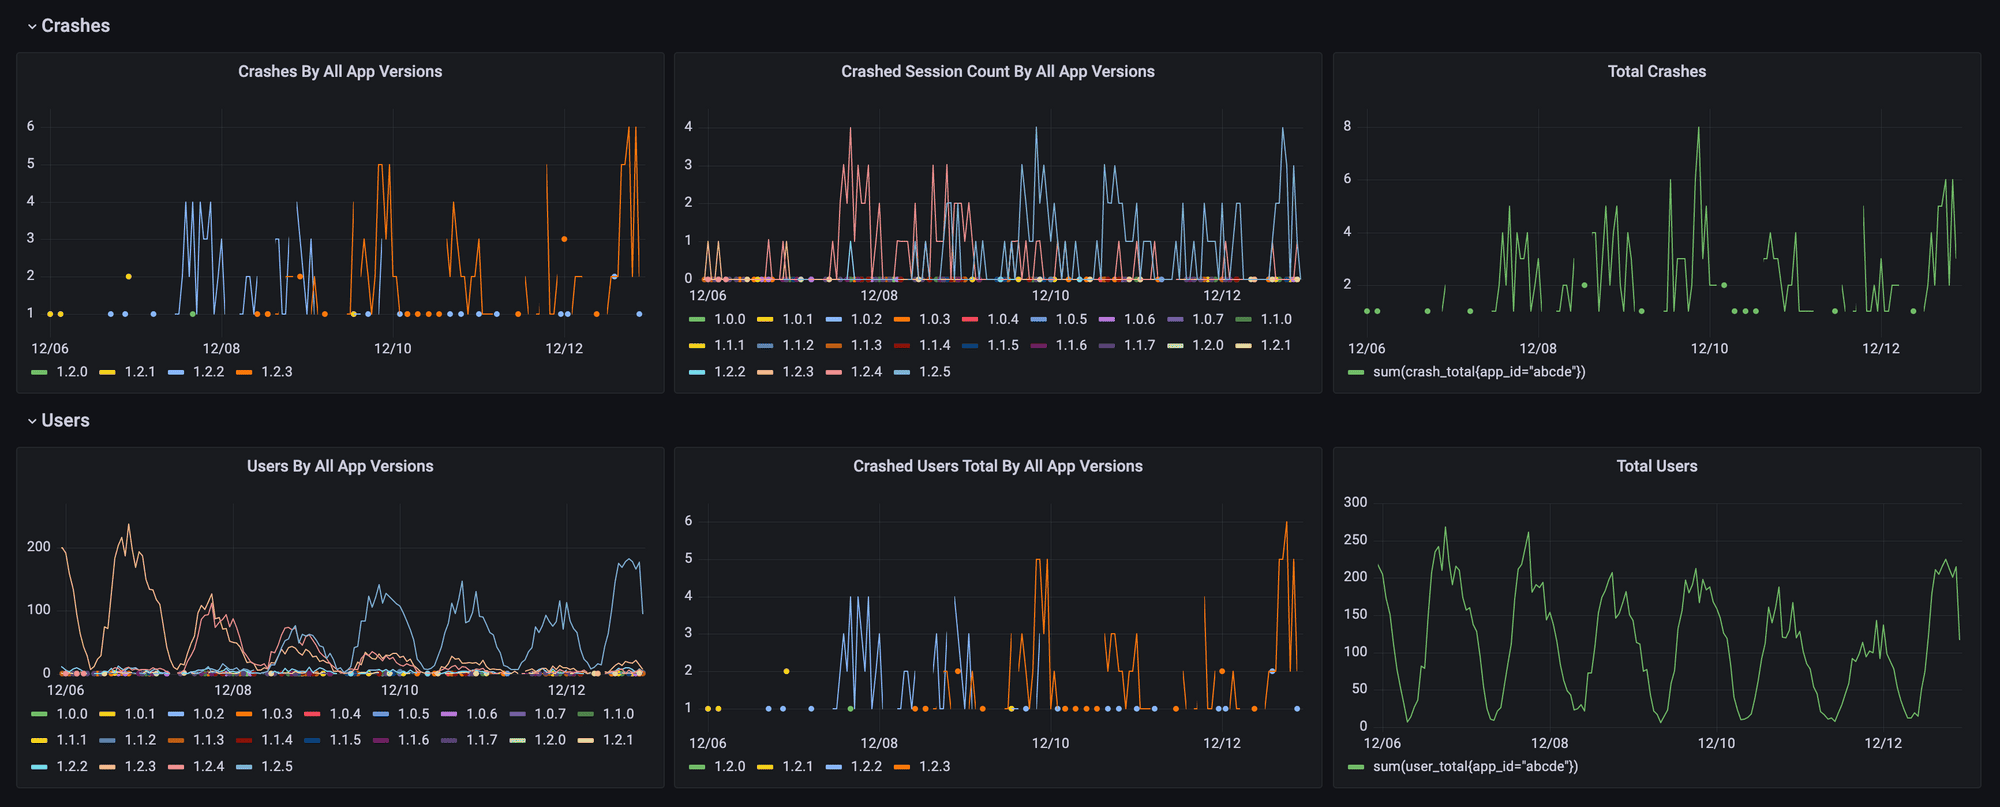
The Embrace plugin for Grafana is simple to install without requiring the tedious manual setup and query process for the Pull API. To get set up, simply download the Embrace plugin from Grafana, install using your Embrace API key and you will immediately gain access to prebuilt Grafana dashboards with Embrace metrics flowing in real time. The Embrace plugin includes a suite of app health and performance widgets in an out-of-the-box dashboard that visualize key crash metrics and KPIs for a given time span. Some metrics included are: percentage of crash-free sessions, total number of crashes, errors reported, user impact metrics and percentages, app versions and much more.
Get started today
The Embrace plugin for Grafana is now available for all Grafana and Embrace customers on the Grafana website. For more information about Embrace or to get a demo, visit the Embrace website. Want to do even more with your Embrace data in Grafana? Learn more about the Embrace Metrics API powering Embrace’s Grafana dashboards.
If you’re new to Grafana, Grafana Cloud is the easiest way to get started with metrics, logs, traces, and dashboards. You can sign up for Grafana’s generous free forever tier and learn more about their plans for every use case.
Get started today with 1 million free user sessions.
Get started free